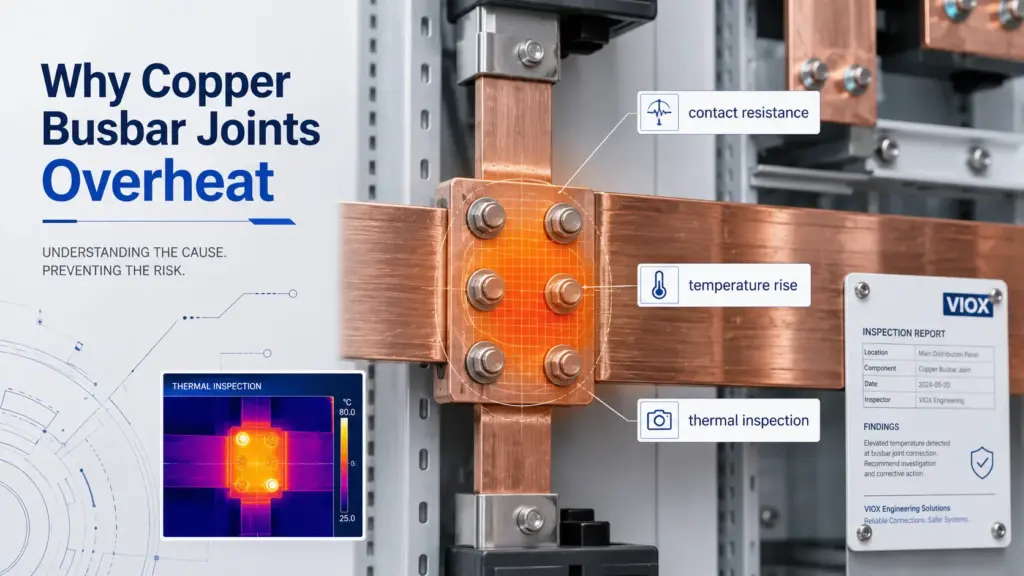
クイックアンサー:電流が変わっていないのに銅バスバーの接続部が熱くなるのはなぜか?
負荷電流が安定していても銅バスバーの接続部が過熱することがあるのは、接続部の抵抗が安定していないためです。銅自体には正の抵抗温度係数があり、ボルトの緩み、熱サイクル、酸化、腐食、メッキの摩耗、接触圧力の低下などを通じて、接触界面が徐々に劣化する可能性があります。.
重要な区別は以下の通りです:
銅の抵抗温度係数は、通常、バスバー接続部の故障の根本原因ではありません。それは加速要因です。.
緩やかなプロセスは、数ヶ月から数年にわたる接触抵抗の劣化です。急速なプロセスは、抵抗と温度が上昇した後の電気的および熱的な反応です。接続部が熱くなると銅の抵抗が増加し、同じ電流でもI²R発熱が増大します。温度が上昇すると、クリープ、酸化、接触劣化がさらに加速します。これが、電流が変わらなくても接続部がわずかな温かさから深刻な過熱状態へと進行する理由です。.
要点
- 銅の抵抗は温度とともに上昇します。. 銅の温度係数は、室温付近で約0.391%/°Cです。.
- 同じ電流値において、銅の温度が高いほどI²R損失(発熱)は大きくなります。. 25°Cと比較して、銅の抵抗値は80°Cで約21%、120°Cで約37%増加します。.
- TCR(温度係数)単独では、通常、収束するプロセスとなります。. 温度上昇に伴い熱損失も増加するため、通常の条件下では銅のTCRのみによって温度が暴走することはありません。.
- 真の長期的な故障原因は、接触抵抗の増大です。. ボルトの緩み、クリープ、熱サイクル、酸化、腐食、および表面損傷は、有効接触面積を減少させます。.
- サーモグラフィによる監視は、経時的な傾向を追跡するものであるべきです。. 単一のホットスポットも重要ですが、数ヶ月から数年にわたる温度上昇率の方が、より適切なメンテナンスの指標となることがよくあります。.
銅の抵抗温度係数(TCR):同じ電流値で発熱が増加する理由
銅は優れた導体ですが、その抵抗率は一定ではありません。温度が上昇すると銅の抵抗率は上昇します。これは抵抗温度係数(TCR)によって説明されます。.
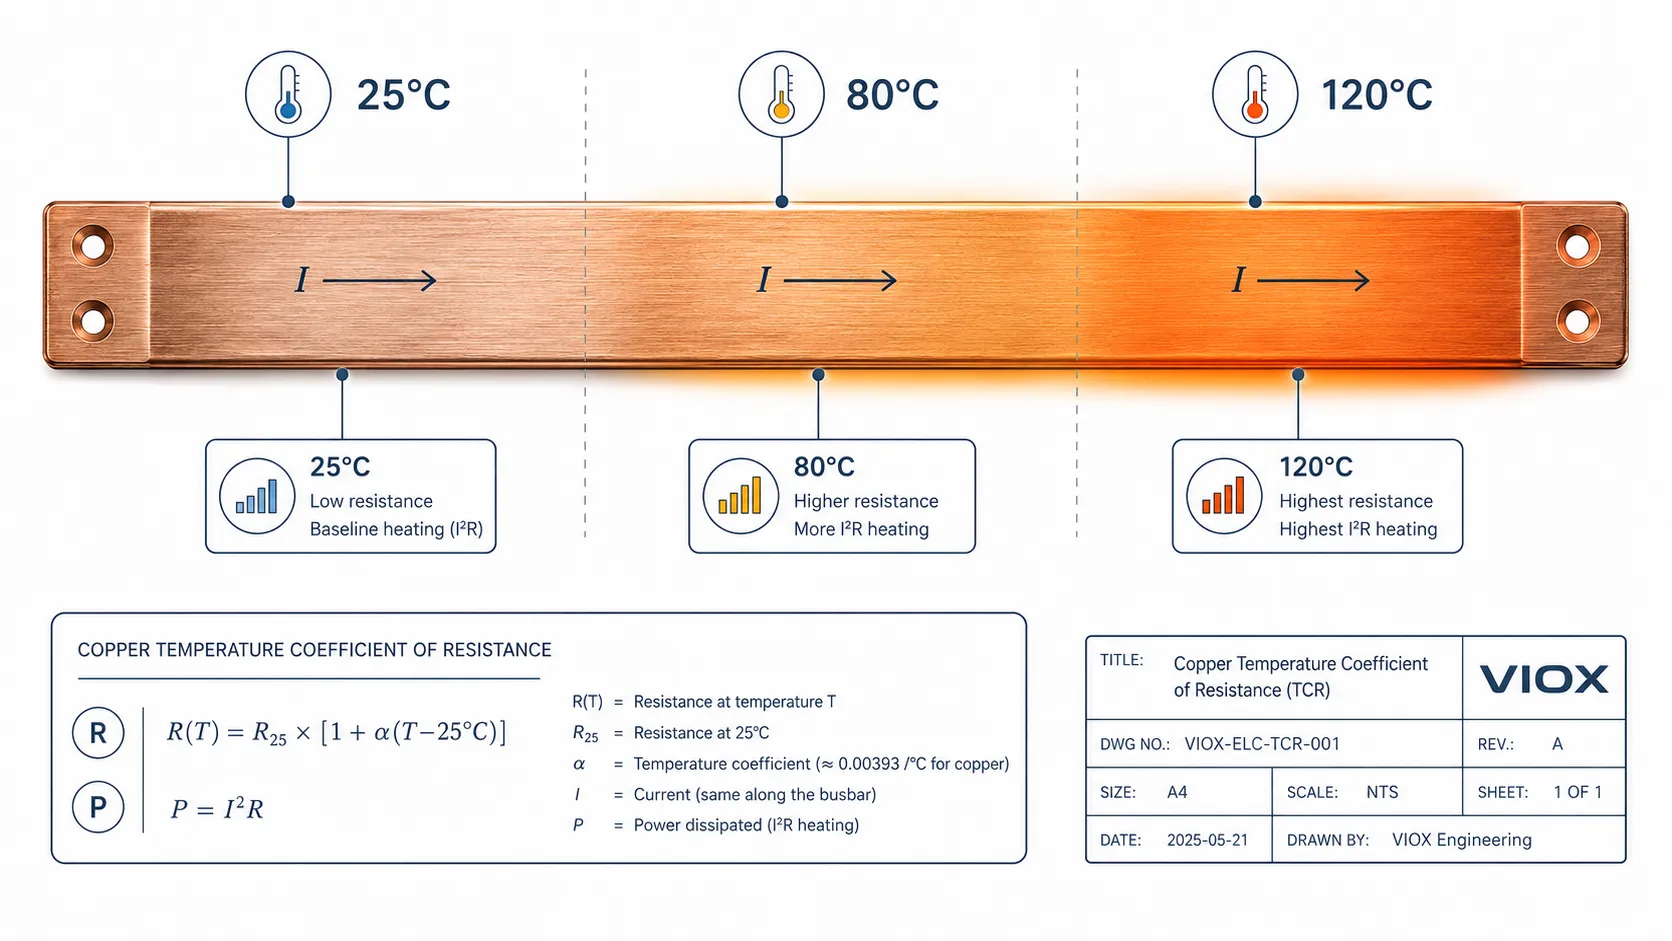
室温付近の銅において、一般的に使用される係数は約以下の通りです:
α ≈ 0.0039 /°C
簡略化された抵抗の関係式は以下の通りです:
R(T) = R25 × [1 + α × (T - 25°C)]
同一電流における発熱量は以下の通りです:
P = I²R
したがって、電流が一定であっても抵抗が上昇すれば発熱量は増加します。.
| 銅の温度 | 25°Cに対する抵抗増加率(概算) | 同一電流における影響 |
|---|---|---|
| 55°C | +12% | I²R発熱量は約12%増加 |
| 80℃ | +21% | I²R発熱量は約21%増加 |
| 100°C | +29% | I²R発熱は約29%高い |
| 120°C | +37% | I²R発熱は約37%高い |
これが、ある温度では許容範囲内であったバスバーの接続部が、より高い温度ではより大きな負荷となる理由です。電流は変化していませんが、抵抗が変化しているためです。.
電気伝導率と電気抵抗率の背景については、VIOXのガイドを参照してください。 伝導率 vs 抵抗率 vs %IACS.
なぜTCR単独が根本原因となることは通常ないのか
銅のTCR効果は確かに存在しますが、それ単独では通常、新しい熱平衡状態に達します。.
銅バスバーの接続部が25°Cから55°Cに上昇すると、銅の抵抗が増加し、I²Rによる発熱が増大します。その余分な熱によって温度がわずかに上昇する可能性があります。しかし、温度が上昇するにつれて、接続部から周囲の空気や表面への放熱も増加します。.
放熱は以下の経路で増加します:
- 対流
- 放射
- 接続された銅材、締結部品、支持体、および筐体構造への伝導
適切な接触圧が維持されている健全な接続部では、温度は通常一定の値に落ち着きます。TCR(抵抗温度係数)に関連する追加の発熱が無限に増大することはありません。.
これが、清掃され適切にトルク管理されたバスバー接続部において、最初の熱平衡点からわずか数度しか温度が上昇しない理由です。TCRは平衡状態を変化させますが、自動的に故障を引き起こすわけではありません。.
緩やかな問題:接触抵抗の劣化
重大な故障経路は、バスバー接続部の接触界面が経時変化することから始まる。.
バスバー接続部は完全な金属同士の塊ではない。電流は多数の微細な接触点を介して流れる。実際の接触面積は見かけ上の重なり面積よりもはるかに小さい。接触圧力を低下させたり、それらの微細な接触点を損傷させたりするあらゆる要因が、接触抵抗を増大させる。.
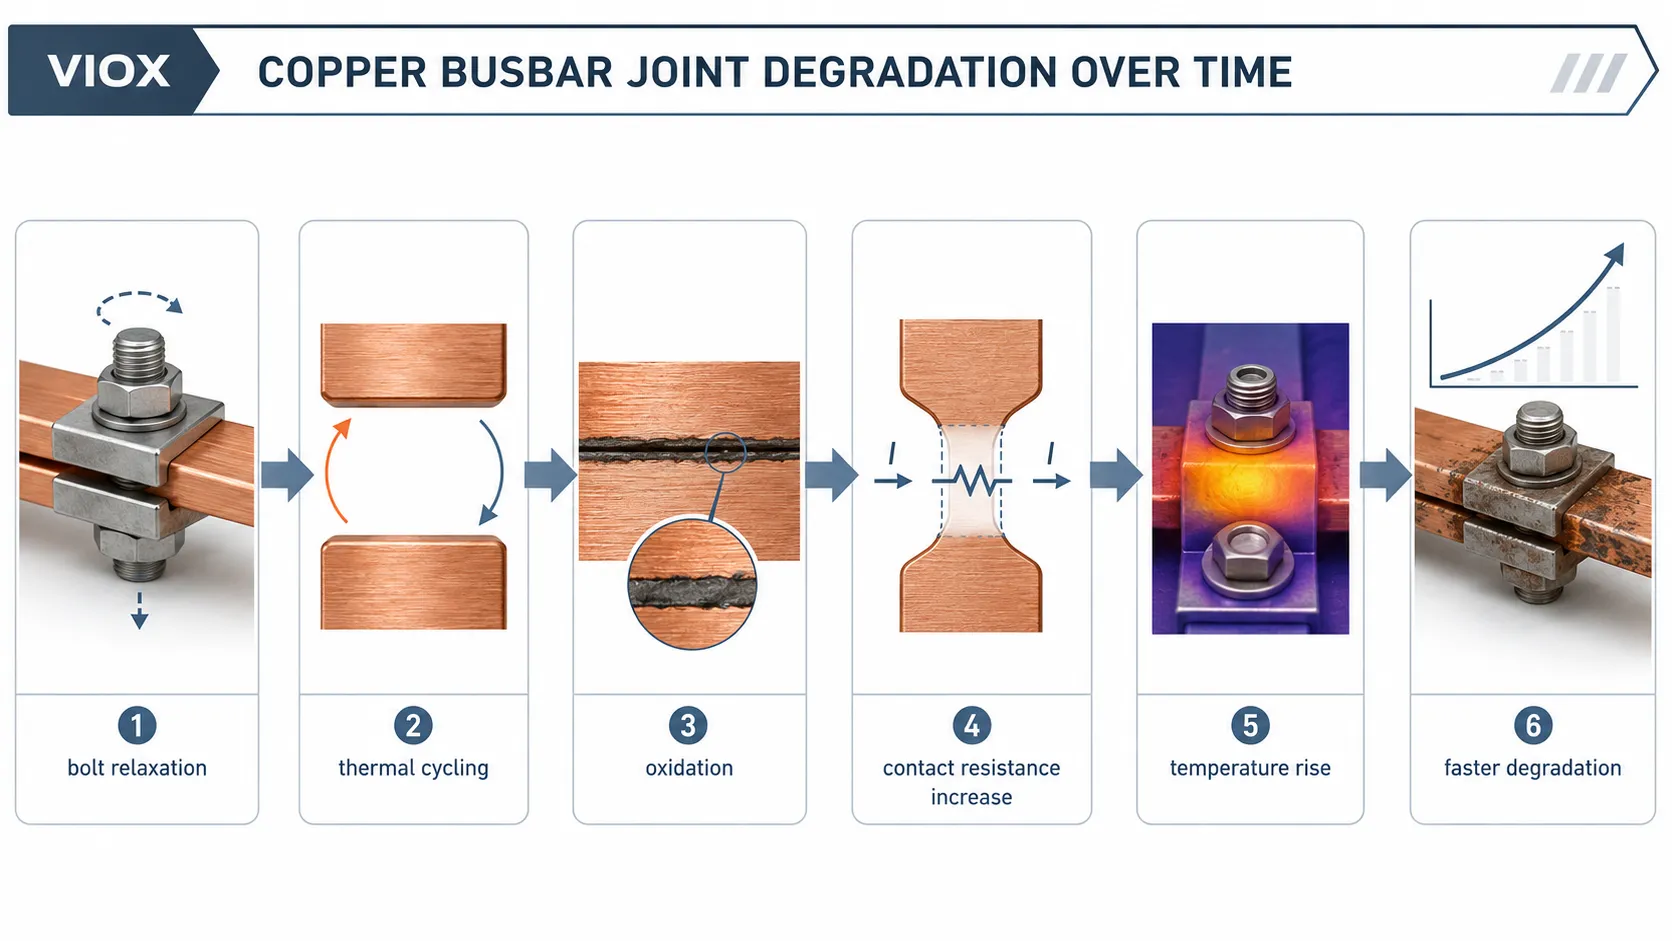
一般的な長期劣化メカニズムは以下の通りである:
| 劣化メカニズム | 接続部で発生する現象 | 結果 |
|---|---|---|
| ボルトの緩みおよびクリープ | 特に熱の影響下において、締め付け力が経時的に低下する | 接点圧の低下 |
| 熱サイクリング | 日々の負荷変動による膨張と収縮 | 微小な動きによる接点表面の損傷 |
| 酸化 | 接点界面への空気接触による酸化被膜の形成 | 有効接触面積の減少 |
| 腐食または硫化物による汚染 | 産業環境による露出金属表面への影響 | 接触抵抗の上昇 |
| メッキの摩耗 | 微細な動きや不適切な組み立てによるスズまたは銀メッキの損傷 | 母材の露出の増加 |
| 初期設置の不備 | トルク不足・過剰、表面の汚れ、位置ずれ、不均一な圧力 | 高い初期抵抗 |
接触抵抗が上昇すると接続部の温度が上昇する。接続部の温度が上昇すると接触劣化が加速する。これが真の正のフィードバックループである。.
高速プロセス対低速プロセス
母線接続部の過熱を理解する上で最も有効な方法は、2つの時間軸に分けて考えることである。.
| プロセス | 時間軸 | 駆動要因 | 意味 |
|---|---|---|---|
| 銅の温度係数(TCR)応答 | 数分から数時間 | 温度上昇による銅抵抗の増大 | 通常は新たな熱平衡状態に落ち着く |
| 接触界面の劣化 | 数ヶ月~数年 | 締め付け力の低下、酸化、腐食、熱サイクル | 接続部の抵抗が継続的に増加する可能性がある |
現場でのパターンは多くの場合、以下のようになる
- バスバーの接続部は、わずかに上昇した接触抵抗から始まる.
- 負荷電流が接続部にI²R発熱を生じさせる.
- 温度が上昇する.
- 銅の温度係数(TCR)により抵抗が増加し、さらなる発熱が加わる.
- 温度上昇がクリープ現象と酸化を加速させる.
- 接触抵抗がさらに増加する.
- 次の点検で、より高いホットスポットが確認される。.
この連鎖において、TCR(抵抗温度係数)は最初の故障原因ではない。それは、温度上昇に伴い劣化箇所の発熱を急激に増大させる増幅器である。.
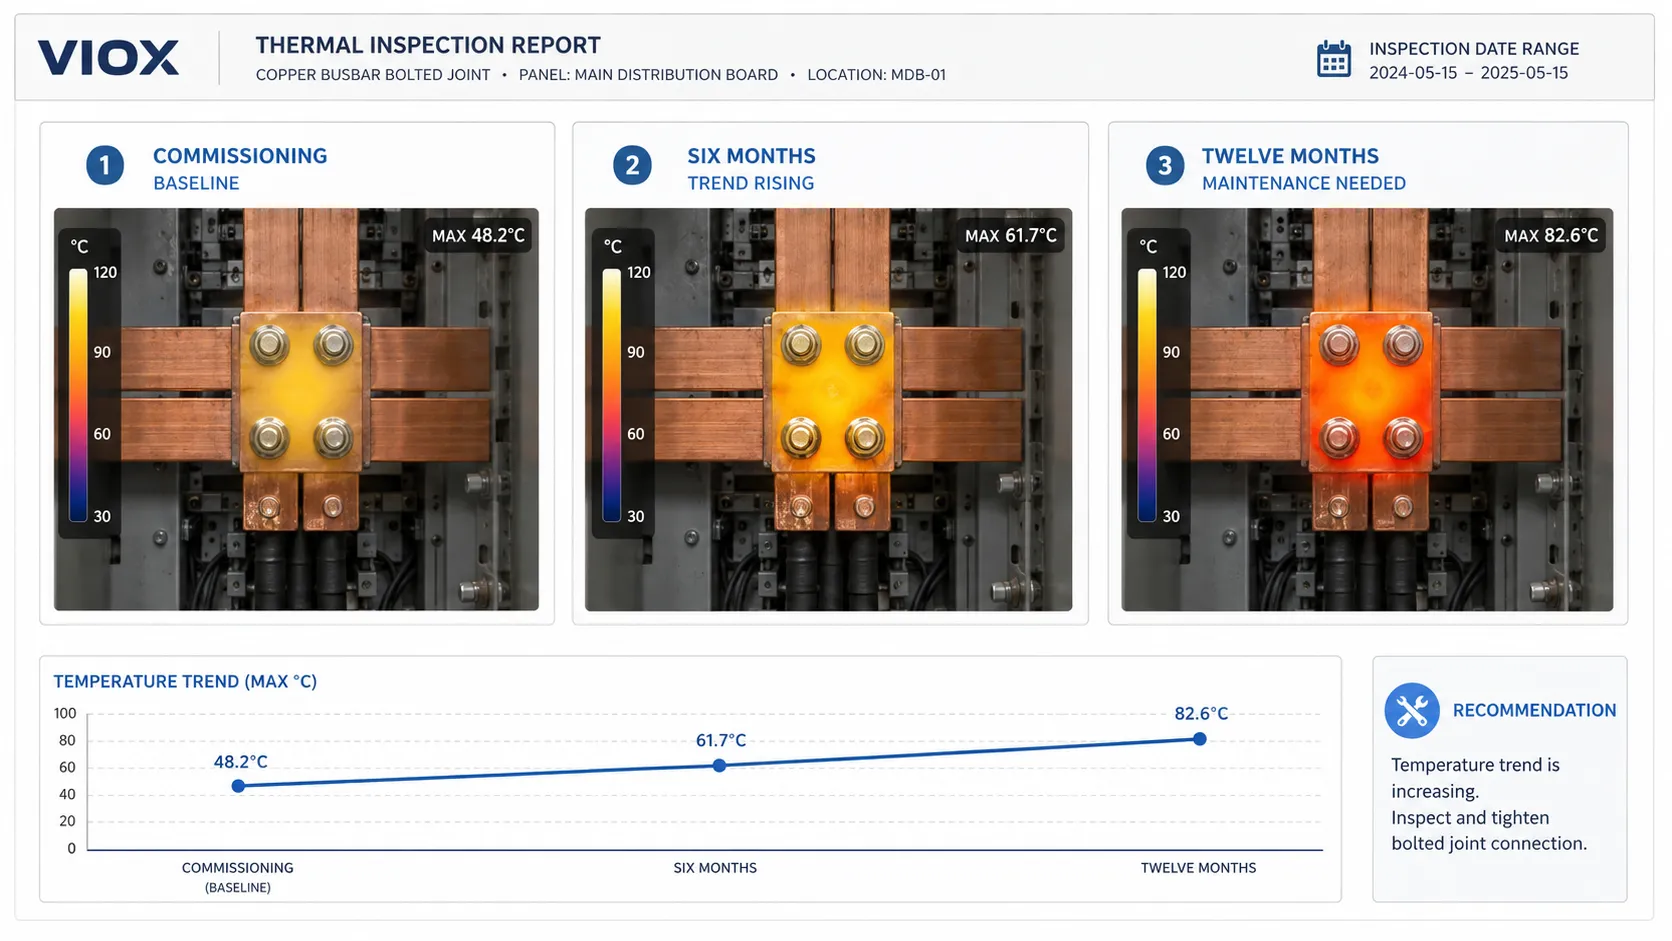
現場事例:55°Cから85°C、そして110°Cへ
一般的なメンテナンス事例は以下の通りである:
- 試運転時の点検:接続部の温度は約55°C。.
- 6ヶ月後:同等の負荷条件下で、同じ接続部が約85°Cに達する。.
- さらに6ヶ月後:接続部は110°Cを超える。.
- 負荷電流に大きな変化はない。.
誤った結論は、「銅が制御不能なほど自己発熱した」というものです。“
より適切な診断は、「接続部の接触抵抗が上昇傾向にあり、銅の抵抗温度係数(TCR)が温度上昇に伴って熱的影響を増幅させている」というものです。“
ある接続部の接触抵抗が初期の20マイクロオームから30マイクロオームに上昇した場合、温度による追加の影響を考慮する前段階で50%の増加となります。その後さらに抵抗が上昇すると、接続部はすでに高温領域で動作しているため、温度の急上昇がより顕著になります。.
サーモグラフィの活用方法
サーモグラフィは負荷時の異常な熱分布を可視化できるため有用です。しかし、一度の点検画像は単なるスナップショットに過ぎません。通常、単一の数値よりも経時的な傾向の方が価値があります。.
バスバー接続部を点検する際は、以下を比較してください:
- 同一箇所の経時的な変化
- 同様の負荷条件下における類似の接続部
- 相間の温度差
- 上流側および下流側の接続部温度
- 周囲温度および筐体状態
- 点検時の負荷電流
| 熱パターン | 推定される解釈 |
|---|---|
| 類似の接続部と比較して著しく高温な接続部 | 接触不良または設置上の欠陥 |
| 全相が均一に発熱している | 高負荷、筐体内温度の上昇、または換気不足 |
| 特定の相が年々徐々に上昇している | 接触劣化の傾向 |
| ボルト締結部のホットスポット | クランプ、接触面、または接続インターフェースの問題 |
| ケーブルラグまたは端子部のホットスポット | 接続部の問題であり、必ずしもバスバー本体の問題ではない |
多くの保守プログラムでは熱異常を温度差で分類しているが、正確なアクション閾値は施設保守基準、機器メーカーのガイダンス、および適用される点検慣行に従うべきである。一般的な温度数値を普遍的なものとして扱ってはならない。.
マイクロオーム試験:なぜベースラインが重要なのか
サーモグラフィは熱の発生箇所を特定する。低抵抗試験は、接合部の抵抗が変化したかどうかを定量化するのに役立つ。.
バスバーの接合部において、最も有用なマイクロオーム測定値は、多くの場合、絶対値ではない。それは、設置時または試運転時に取得したベースライン測定値との比較である。.
| 測定アプローチ | 実用的価値 |
|---|---|
| 設置後の初期ベースライン | 基準状態を確立する |
| 年次シャットダウン時に同一箇所を測定する | 抵抗値のドリフトを示す |
| 同一アセンブリ内の各相を比較する | 異常な接合部の挙動を特定する |
| 同様の形状条件下にある類似の接合部を比較する | 設計温度と欠陥による温度を切り分けるのに役立つ |
マイクロオーム測定はプローブの配置、表面状態、温度、試験方法の影響を受けやすいため、わずかな差異は測定ノイズである可能性がある。単発の測定値よりも、明確な上昇傾向の方が重要である。.
バスバーの接続部が早期に劣化する理由
バスバーの接続部で過熱が発生しやすくなる3つの条件.
1. 高電流密度
電流密度が高くなると、ベース温度の上昇を招きます。接続部の動作温度が上昇すると、クリープ現象、酸化、熱サイクルによる影響がより深刻化します。.
発熱量は電流の2乗に比例します:
P = I²R
接触抵抗が既に高い場合、わずかな電流の増加でも発熱が大幅に増大する可能性があります。.
2. 初期接触品質の不良
接触圧力の不足、表面の不均一、汚染、トルク設定の誤り、またはメッキの損傷がある状態で開始された接続部は、最初から抵抗値が高くなります。時間の経過とともに、その劣化プロセスはより悪い基準値から進行することになります。.
施工品質が重要です:
- 正しい締め付けトルク
- 清潔な接触面
- 正しい重なり面積
- 平坦な接触面
- 適切なワッシャーおよび締結部品
- 正しいメッキの適合性
- 安定した機械的サポート
バスバーの材質およびメッキの選定については、VIOXの資料を参照してください。 バスバー選定ガイド.
3. 放熱不良
同じ接続抵抗であっても、環境によって温度が異なる場合があります。.
リスクの高い環境には以下が含まれます:
- 密閉されたIP54またはIP65エンクロージャー
- 積層バスバーアセンブリ
- 粉塵の多いキャビネット
- 直射日光にさらされるソーラーコンバイナーボックス
- 高地または換気の悪い部屋
- 通気性が制限されたケーブルコンパートメント
- 高密度な端子およびバスバーの配置
太陽光発電(PV)直流機器において、ケーブルグランド、端子、ヒューズホルダー、およびバスバーの接続部は、熱システムとして一体となって機能します。関連するPVエンクロージャーの過熱問題については、以下を参照してください。 太陽光発電用集電箱の過熱原因.
点検および保守チェックリスト
| 保守手順 | なぜそれが重要なのか |
|---|---|
| 試運転時の熱画像記録 | ベースラインを作成する |
| 各点検時に負荷電流を記録する | 熱画像の比較を可能にする |
| 相間の温度を比較する | 接続部の異常な挙動を検出する |
| 単一の閾値だけでなく、年次推移を確認する | 加速する劣化を発見する |
| 停止中に接続部の抵抗を測定する | 接触抵抗のドリフトを確認する |
| 手順に従ってボルトの締め付けトルクを点検する | クランプ力の低下を検出する |
| 表面の酸化や変色を点検する | 接触部の損傷を特定する |
| エンクロージャーの換気状態と塵埃を確認する | 冷却状態を確認する |
| 負荷変動を確認する | 過負荷と接続部の劣化を分離する |
大型バスバー接続部の場合、試運転後の最初の保守点検が特に重要です。一部のクランプシステムは、最初の熱サイクル後に緩みが生じることがあります。適切な増し締め作業は、締結システム、メーカーの指示、および施設の保守手順に従う必要があります。.
バスバー接続部の過熱診断における一般的な間違い
間違い1:すべての過熱箇所を負荷の問題として扱うこと
電流が安定しており、特定の接続部のみが過熱している場合、問題は負荷電流ではなく接触抵抗にあることがほとんどです。.
間違い2:1枚の熱画像のみを確認すること
同様の接続部と比較して20°C高い接続部は注意が必要です。しかし、1年間で温度差が8°Cから16°Cに上昇した接続部は、長期間にわたって適度な温度差で安定している接続部よりも優先的に対応すべき可能性があります。.
間違い3:最初のベースラインを無視すること
試運転時の温度およびマイクロオームのベースラインデータがなければ、保守チームは設計上の温度と経年劣化による温度上昇を容易に区別することができません。.
ミス4:接触面を点検せずに増し締めを行うこと
接触面が酸化、孔食、汚染、またはメッキ損傷している場合、増し締めだけでは信頼性の高い接合部を復元できない可能性があります。.
ミス5:エンクロージャー(筐体)を考慮しないこと
母線(バスバー)の接合部は熱システムの一部です。エンクロージャーの温度、換気、ケーブルの配線、粉塵、および近接する熱源はすべて結果を変化させる要因となります。.
端子台およびMCBバスバーの過熱との関連性
同じ物理的論理が、より小型の電気接続部にも当てはまります。.
端子台は、接触圧の低下、配線処理の不備、または定格電流を超過した場合に過熱する可能性があります。このトピックについては、以下を参照してください。 「制御盤における端子台の過熱」.
MCB用コーム型バスバーは、挿入ミス、端子の締め付け不良、バスバーのサイズ不足、ネジの緩み、または互換性のない機器の使用により過熱する可能性があります。より限定的な用途については、以下を参照してください。 MCBバスバーの過熱原因と対策.
大型銅バスバーの接続部は規模こそ異なりますが、核心となる原理は同じです。 接触圧力と接触抵抗が、負荷がかかった状態で接続部が低温に保たれるかどうかを決定します。.
結論
銅バスバー接続部の過熱は、単なる電流の問題ではありません。それは接触抵抗の問題であり、材料温度の問題であり、そしてメンテナンスの傾向に関する問題でもあります。.
銅の温度係数は、銅の経路が熱くなるほど抵抗が増大し、同じ電流でもI²Rによる発熱量が増えることを意味します。しかし、長期的な障害は通常、ボルトの緩み、クリープ、熱サイクル、酸化、腐食、メッキの摩耗、または初期組み立ての不備といった、接続界面から始まります。.
メンテナンスエンジニアにとって最も重要な問いは、「今日の温度は何度か?」だけでなく、「この接続部は時間の経過とともにどれくらいの速さで温度が上昇しているか?」という点です。“
熱画像、負荷電流、およびマイクロオーム測定値を傾向として追跡してください。それこそが、銅バスバーの接続部を「潜在的なメンテナンス課題」から「予測可能かつ予防可能な故障」へと変える方法です。.