


On this page
Yes. Retained cold work usually reduces the electrical conductivity of high-conductivity copper while increasing its strength and hardness. The size of the change depends on the copper grade, deformation and subsequent heat treatment. For busbars, specify the final temper and conductivity, not simply “hot-rolled” or “cold-rolled.” A conductivity difference is not a universal current-rating reduction.
By VIOX Editorial Team. This is a source-based materials explanation; historical measurements, conceptual illustrations and the illustrative calculation below are not VIOX product test results.
Why Cold Work Changes Copper Conductivity
Cold rolling, drawing and forming permanently deform copper below the conditions needed for substantial recrystallization. “Cold” describes the metallurgical process, not necessarily an unusually low ambient temperature. Deformation changes the grain structure and introduces defects, including dislocations. These changes can impede electron transport while making further plastic deformation more difficult.
The practical tradeoff is increased yield strength and hardness with some loss of conductivity. Increased strength should not be confused with an equivalent increase in elastic modulus: a stronger copper bar can resist permanent deformation better without becoming proportionately stiffer elastically.
The Copper Development Association’s cold-rolled temper guidance explains the rise in tensile and yield strength. Its conductivity discussion also identifies a slight conductivity reduction associated with retained cold work.
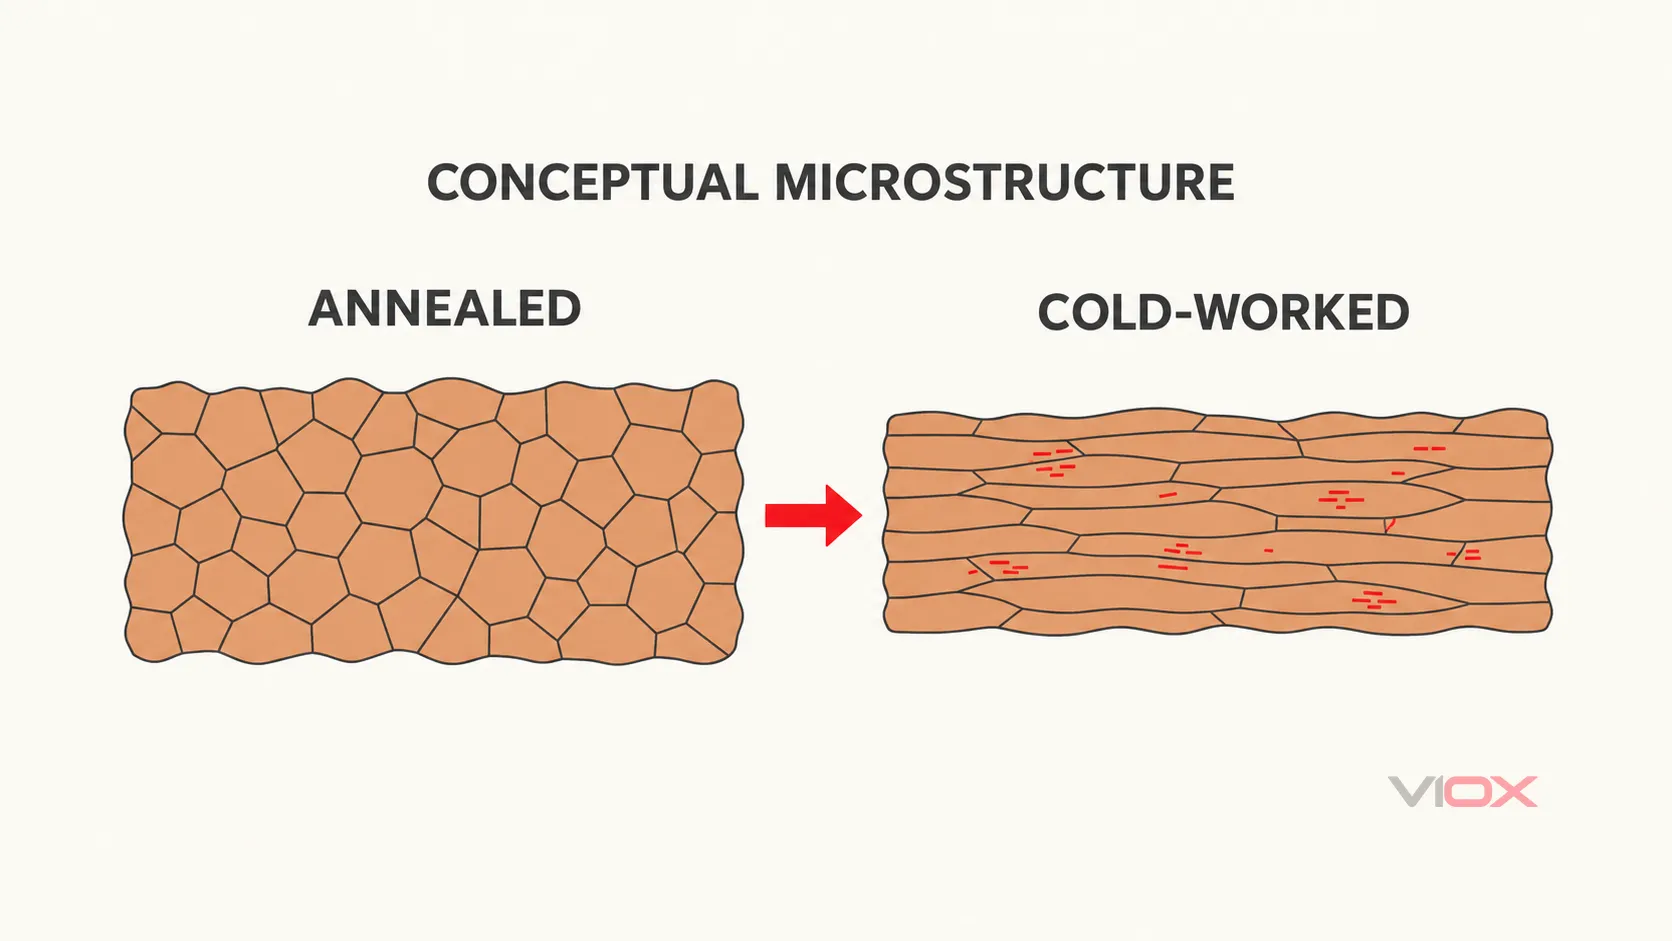
Conceptual microstructure, not a microscope image or a measured grain-size comparison. The diagram illustrates deformation; it does not quantify the conductivity change.
Why the Reduction Is Not a Fixed Percentage
The effect depends on composition, starting microstructure, deformation amount and direction, and any subsequent thermal treatment. A light finishing operation and a heavily drawn wire do not necessarily retain the same state.
Nor is conductivity guaranteed to fall monotonically through every possible deformation schedule. A 2021 primary study of low-oxygen copper wires reported a decrease followed by an increase with drawing strain in its investigated conditions. Grain boundaries, texture and recrystallization contributed to the response. That experiment is a warning against a universal rule, not a recommended busbar processing schedule.
For procurement, a declared minimum conductivity for the specified grade and final temper is more useful than an assumed deduction from a generic “pure copper” value. For the units and reference basis, see conductivity, resistivity and %IACS explained.
Hot-Rolled vs Cold-Rolled Copper: Compare the Final State
Hot rolling and cold rolling describe processing routes. Annealed, half-hard and hard describe material conditions. The labels answer different questions, and a copper product can pass through more than one route before delivery.
Hot working allows recovery or recrystallization under suitable processing conditions. This can reduce the retained work-hardening effect, but hot-rolled is not a synonym for fully annealed. Later finishing, deformation and thermal history still matter. Conversely, a cold-rolled product may be annealed afterward. The Copper Development Association’s annealed-temper guidance explicitly describes annealing after cold working.
The following comparison assumes the same copper grade and composition, with conductivity evaluated at the same reference temperature. It gives qualitative expectations, not acceptance limits.
| Supplied condition | What the process label establishes | Electrical interpretation | Mechanical interpretation |
|---|---|---|---|
| Hot-rolled copper | Elevated-temperature rolling occurred | The label alone does not establish conductivity or prove superiority over another delivered product | Verify the delivered temper and strength; do not assume a fully annealed condition |
| Cold-rolled copper with retained cold work | Rolling deformation remains without sufficient subsequent annealing to remove its effect | Conductivity may be lower than the same material in a suitably annealed state | Yield strength and hardness generally increase; formability can decrease |
| Cold-rolled, then adequately annealed copper | Cold rolling was followed by a heat treatment that changed the retained state | Conductivity can recover toward the grade’s annealed value; verify the actual result | Work-hardening strength can be reduced and ductility restored |
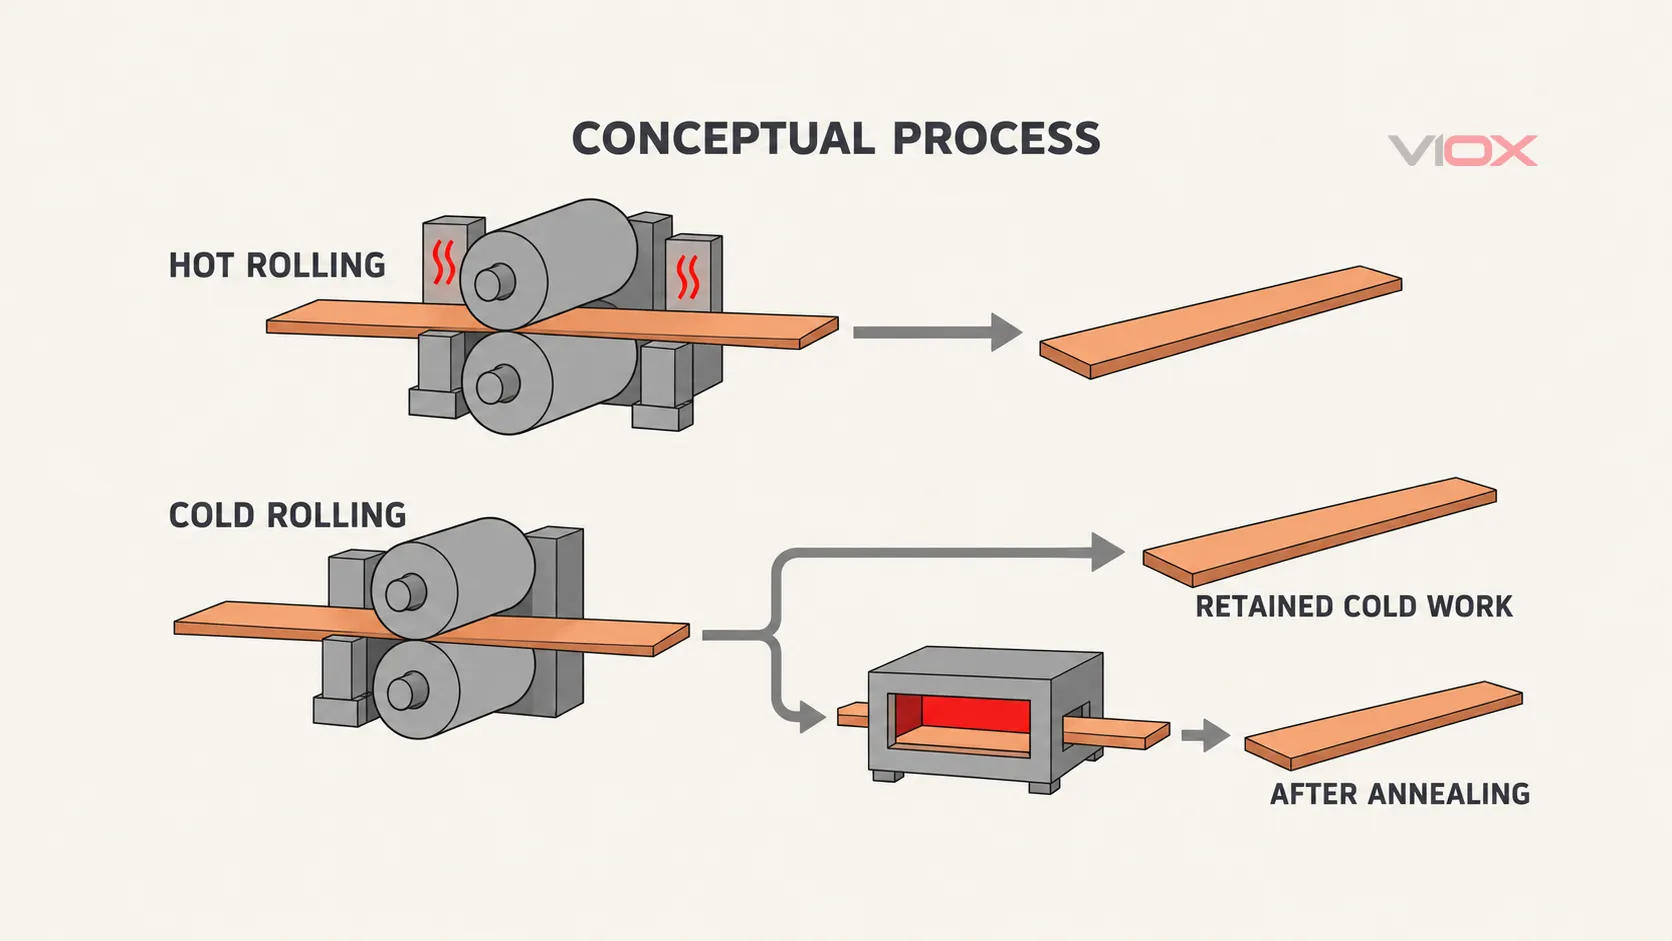
Process-state map only. Arrows describe manufacturing sequence, not electrical wiring, measured conductivity or an exact production recipe.
For a busbar comparison, ask: Are the products the same grade? Were they tested at the same temperature? What is the final temper? What minimum conductivity and mechanical properties does each supplier guarantee?
Surface appearance is not an answer to those questions. A smooth, bright cold-rolled bar is not automatically less conductive, and a hot-worked surface is not proof of higher conductivity. Surface condition matters at a joint, but it is distinct from the bulk material property.
What the Historical Annealed and Hard-Drawn Data Show
Wolff and Dellinger’s 1911 paper, The Electrical Conductivity of Commercial Copper, compared annealed and hard-drawn commercial copper wires.
These Table II means use the first manufacturer’s sample group, averaging three readings per wire size rather than using the printed pooled annealed mean. Differences are calculated before rounding.
| B&S wire size | Annealed mean, original percent-conductivity basis | Hard-drawn mean, original percent-conductivity basis | Difference, percentage points |
|---|---|---|---|
| No.6 | 100.18% | 97.78% | 2.40 |
| No.12 | 100.32% | 97.48% | 2.84 |
| No.18 | 100.19% | 97.10% | 3.09 |
The paper pairs readings from the same material lot. It cautions that No.6 and No.18 evidence was limited and drawing practices affected the size trend. This does not establish an intrinsic wire-diameter rule.
Two interpretation limits are essential. First, subtracting two percentage-conductivity readings produces percentage points, not automatically the relative percentage loss. Second, the table uses the paper’s historical mass-resistivity reference at 20 degrees Celsius. It predates the IACS reference established in 1913, so these readings must not simply be relabeled as modern %IACS. It is an annealed-versus-hard-drawn wire comparison, not a hot-rolled-versus-cold-rolled busbar test.
What a Conductivity Change Means for Busbar Losses
Conductivity affects bulk resistance through the conductor’s length and cross-section:
R = L / (sigma x A)
P = I^2 x R
Here, R is resistance in ohms, L is length in metres, sigma is volume electrical conductivity in siemens per metre, A is cross-sectional area in square metres, and P is resistive power loss in watts at current I in amperes.
Illustrative DC Example: 100% vs 97% IACS
Assume two straight, uniform copper conductors with identical geometry, both evaluated at 20 degrees Celsius:
- Length: 1 metre.
- Cross-section: 100 square millimetres, or
0.0001 m^2. - Current: 200 A DC.
- Conductor A: an assumed
58 MS/m, approximately 100% IACS. - Conductor B: an assumed
0.97 x 58 = 56.26 MS/m, approximately 97% IACS.
These are declared calculation inputs, not measured VIOX values or a reconstruction of the historical table. They represent the scale of a conductivity difference discussed in the independent Copper for Busbars guidance, section 1.2.2.1.2.
R_A = 1 / (58,000,000 x 0.0001)
    = 0.000172414 ohm

R_B = 1 / (56,260,000 x 0.0001)
    = 0.000177746 ohm

R_B / R_A = 100 / 97 = 1.03093| Calculated quantity | Conductor A | Conductor B |
|---|---|---|
| Bulk resistance | 172.41 microohms | 177.75 microohms |
| Power loss at 200 A | 6.90 W | 7.11 W |
| Voltage drop at 200 A | 34.48 mV | 35.55 mV |
Under those assumptions, Conductor B has approximately 3.09% higher resistance and resistive loss, an increase of about 0.21 W over the one-metre section. Conductivity and resistivity are reciprocal quantities, so the resistance increase is not exactly the three-percentage-point conductivity difference.
This example isolates bulk material behavior. It excludes joints, holes, changing cross-sections, AC skin and proximity effects, and the resistance increase as the conductors warm up. It is not an operating-temperature prediction, an allowable temperature-rise calculation or a validated 200 A rating.
Why This Does Not Establish an Ampacity Derating
A busbar’s permissible current depends on heat generation and heat removal, operating temperature limits, dimensions, enclosure conditions and connections. Material conductivity is one input. A three-point conductivity change cannot be turned into a universal three-percent current-rating reduction.
Mechanical strength also matters. A soft condition chosen solely for conductivity may not satisfy the design’s resistance to permanent deformation or forming constraints. A harder condition may be useful, provided its electrical and mechanical evidence supports the assembly. Short-circuit performance requires evaluation of the complete arrangement, not a temper label.
For modular distribution, the MCB busbar selection guide covers device compatibility and ratings. Those checks remain necessary even when the copper conductivity is known.
Specify the Material State, Then Verify the Busbar
For copper busbars, copper earth or neutral bars, and copper terminal parts, request evidence that identifies the delivered condition. A useful material record should include:
| Evidence to request | Question it answers |
|---|---|
| Copper grade and applicable material specification | Are the compared parts actually the same material, rather than merely both described as copper? |
| Final temper or agreed delivery-condition designation | Is cold work retained, partly relieved or followed by annealing? |
| Minimum conductivity or maximum resistivity, with reference temperature | What electrical property is guaranteed for this grade and condition? |
| Mechanical properties appropriate to the part | Does the supplied state meet the relevant strength and forming requirements? |
| Finished dimensions and relevant tolerances | Does the actual conducting cross-section match the resistance calculation? |
| Test method, sampling basis and lot traceability | Can the declared property be connected to the delivered material? |
A polished surface or a hardness reading alone does not establish electrical conductivity. Likewise, a raw-material certificate cannot by itself verify the finished busbar’s temperature rise, terminal compatibility or assembly short-circuit performance.
Keep bulk and joint resistance separate. If heating is concentrated at a connection, changing copper temper is not a substitute for checking that interface. The copper busbar joint overheating explanation addresses contact pressure, degradation and temperature effects; those mechanisms are different from the conductivity change in an intact bar.
Do not heat an installed busbar to try to recover conductivity. A material heat treatment can alter mechanical properties, dimensions, plating and adjacent insulation. Any required annealing belongs in a controlled manufacturing specification, followed by verification of the finished part.
For wider system context, use the busbar overview. When evaluating VIOX MCB busbars, request the exact model’s material and product documents rather than assigning a conductivity or current rating from this example.
The specification should describe what is delivered: copper grade, final temper, electrical property and mechanical requirements. “Hot-rolled” and “cold-rolled” are useful process information, but neither replaces that evidence.
Sources
- Wolff, F. A., and Dellinger, J. H. (1911), The Electrical Conductivity of Commercial Copper, Table II and discussion of sample pairing, drawing practice and percent conductivity.
- Copper Development Association / European Copper Institute (2014), Copper for Busbars: Guidance for Design and Installation, conductivity, mechanical properties and current-carrying-capacity principles. This edition is technical background, not a statement of current mandatory project requirements.
- Yang and colleagues (2021), Effect of cold drawing strain on the microstructure, mechanical properties and electrical conductivity of low-oxygen copper wires, primary research on the investigated wire-processing conditions.
- Copper Development Association, Annealed Tempers, Cold Rolled Tempers, and Discussion of Conductivity.
- Copper Development Association (2006), High Copper Alloys, Electrical Conductivity/Resistivity section, for the IACS reference date and 58 MS/m basis only.


