Direct Answer
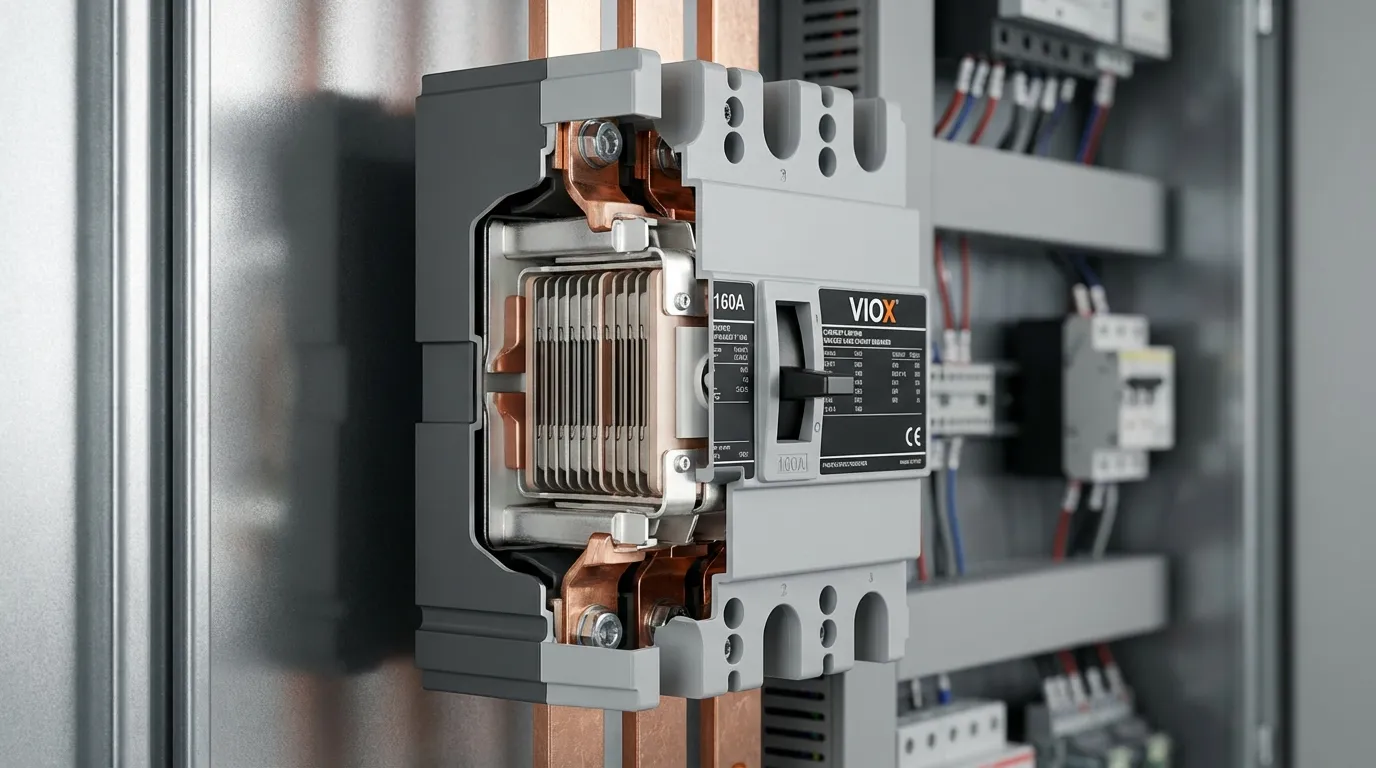
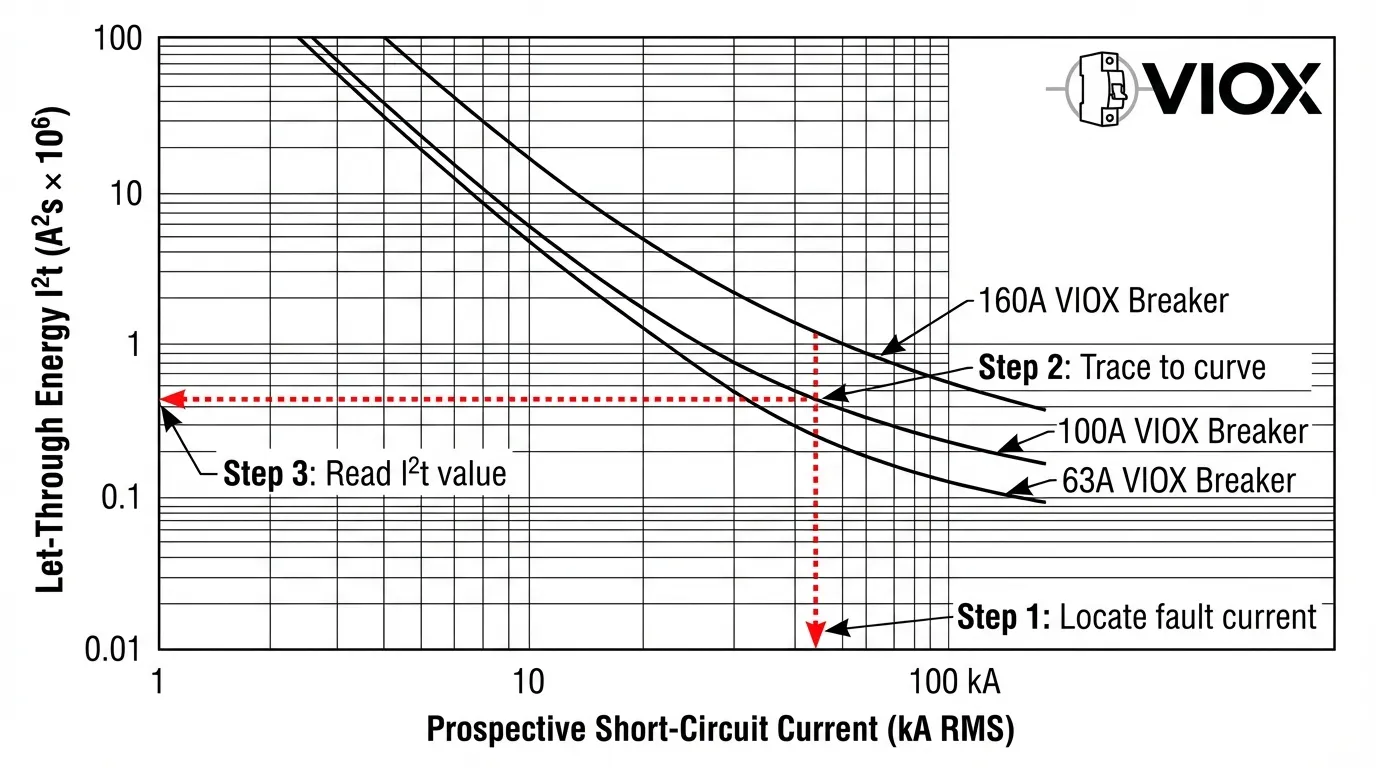
The I²t (permissible energy) curve of a circuit breaker shows the thermal energy that passes through during fault interruption. Reading this curve is straightforward: locate your prospective short-circuit current on the X-axis, trace upward to intersect the breaker’s curve, then read the corresponding I²t value on the Y-axis. This value must be less than your conductor’s thermal withstand capacity (K²S²) to ensure safe operation. For example, a 160A current-limiting breaker interrupting a 100kA fault typically limits I²t to approximately 0.48×10⁶ A²s, preventing cable and busbar thermal damage that would otherwise occur within milliseconds.
What Is I²t and Why It Matters for Electrical Safety
When a short-circuit fault occurs in an electrical system, the massive current surge generates intense heat through the I²R effect. The total thermal energy absorbed by conductors depends on both the magnitude of current and the duration before the protective device clears the fault. This relationship is expressed as I²t—the integral of current squared over time, measured in ampere-squared seconds (A²s).
Current-limiting circuit breakers possess a critical advantage: they dramatically reduce both the peak current and clearing time during faults. According to IEC 60947-1 standards, the permissible energy curve (also called let-through energy curve) quantifies exactly how much thermal stress the breaker allows downstream conductors to experience. Understanding and applying these curves prevents conductor overheating, insulation damage, and potential fire hazards in electrical installations.
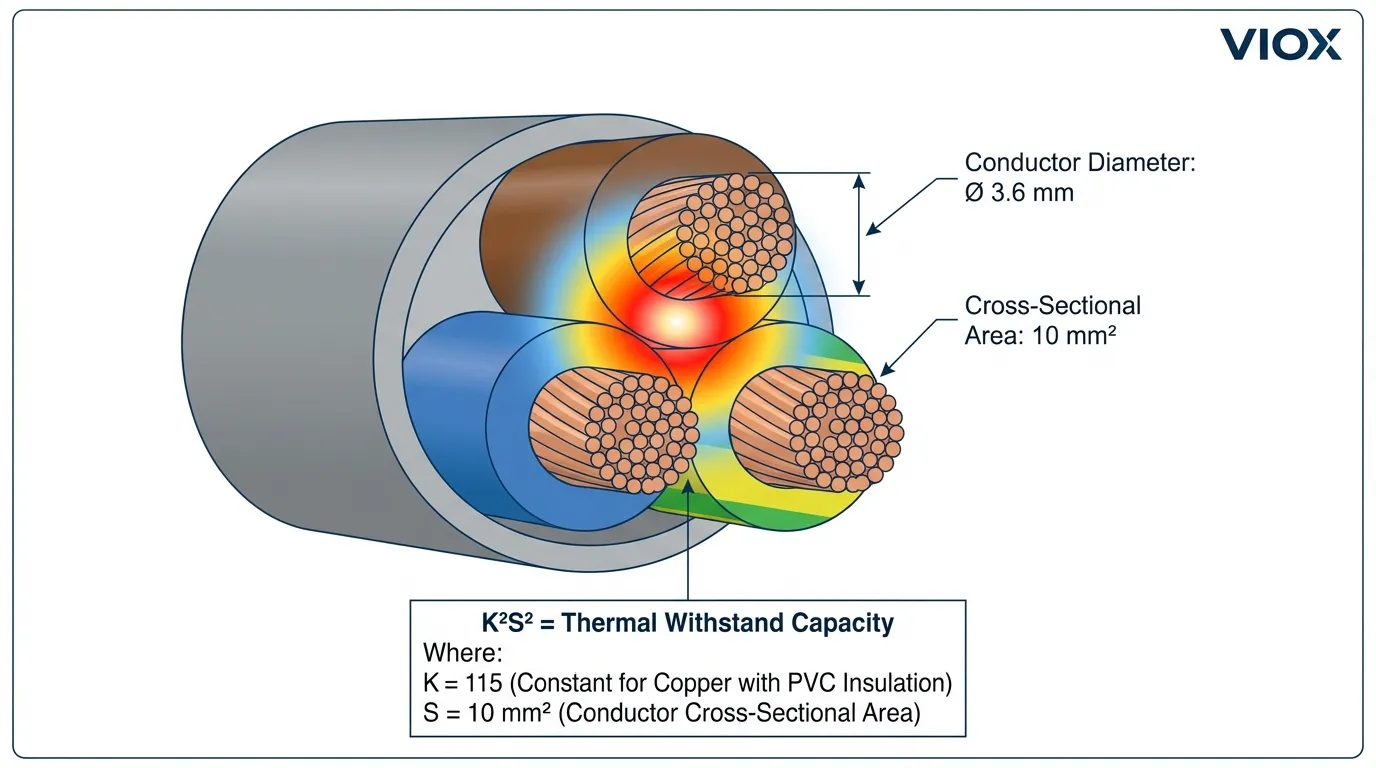
Modern electrical systems increasingly rely on smaller conductor cross-sections for cost efficiency, making thermal protection more critical than ever. A standard 10mm² PVC cable can withstand only 1.32×10⁶ A²s before insulation failure, yet a non-current-limiting breaker might allow several times this energy to pass during a high-magnitude fault.
How Current-Limiting Breakers Reduce Thermal Stress
The Physics of Current Limitation
Current-limiting circuit breakers employ rapid contact separation combined with specialized arc-quenching chambers. When fault current begins to flow, the breaker’s contacts open within 2-5 milliseconds—often before the fault current reaches its first prospective peak. The arc voltage created during interruption opposes the system voltage, effectively inserting impedance into the fault path and “chopping” the current waveform.
This current-limiting action produces two measurable benefits captured in manufacturer data sheets: the peak let-through current (Ip) and the let-through energy (I²t). While peak current determines mechanical stress on busbars, the I²t value governs thermal stress on all conductors in the fault path.
Comparing Limited vs. Unlimited Fault Energy
Consider a 100kA prospective short-circuit on a system protected by different devices:
| Protection Device | Clearing Time | Peak Current | I²t Value | Temperature Rise (100×10mm busbar) |
|---|---|---|---|---|
| No protection | N/A | 141 kA peak | Catastrophic | Vaporization |
| Standard MCCB (short-time delay) | 500 ms | 100 kA RMS | ~5×10⁹ A²s | >500°C (failure) |
| Current-limiting MCCB (160A) | 8 ms | 42 kA peak | 0.48×10⁶ A²s | 71°C (safe) |
| Current-limiting fuse (160A) | 4 ms | 38 kA peak | 0.35×10⁶ A²s | 70.5°C (safe) |
This comparison demonstrates why current-limiting protection is essential for modern installations with high available fault currents. The reduction in I²t by three to four orders of magnitude transforms a catastrophic thermal event into a manageable temperature excursion.
Reading I²t Curves: A Step-by-Step Guide
Understanding the Curve Format
Manufacturer datasheets present I²t curves on logarithmic scales with prospective short-circuit current (X-axis) plotted against let-through energy (Y-axis). Multiple curves typically appear on one chart, representing different breaker frame sizes or ratings within a product family.
Five Steps to Apply I²t Curves
Step 1: Calculate Prospective Short-Circuit Current
Determine the maximum available fault current at the point of installation using system impedance calculations per IEC 60909 or equivalent standards. This represents the current that would flow if the breaker were replaced by a solid conductor.
Step 2: Locate Current on X-Axis
Find your calculated prospective current value on the horizontal axis of the I²t curve chart. If your value falls between gridlines, interpolate logarithmically or use the next higher value for conservative results.
Step 3: Trace Vertically to Breaker Curve
Draw an imaginary vertical line upward from your current value until it intersects the curve corresponding to your specific breaker rating. Different ampere ratings have distinct curves—ensure you’re reading the correct one.
Step 4: Read I²t Value on Y-Axis
From the intersection point, trace horizontally to the left Y-axis to read the let-through energy value. Note the units carefully—values are typically expressed as A²s × 10⁶ or similar scientific notation.
Step 5: Compare with Conductor Withstand
Verify that the breaker’s I²t value is less than the conductor’s maximum thermal withstand capacity using the formula K²S² (explained in the next section).
Common Reading Mistakes to Avoid
Engineers frequently make three critical errors when interpreting I²t curves:
Confusing RMS and Peak Values: The X-axis shows prospective RMS symmetrical current, not peak asymmetrical current. Using peak values will position you incorrectly on the curve, typically resulting in overly optimistic I²t readings.
Mismatching Breaker Ratings: Product families often display multiple curves on one chart. Always verify you’re reading the curve that matches your installed breaker’s ampere rating and breaking capacity (e.g., a “C” curve 10kA breaker differs from an “N” curve 36kA breaker of the same amperage).
Ignoring Logarithmic Scaling: Both axes use logarithmic scales. A small visual distance on the chart represents a large numerical change. Always read values carefully from the axis labels rather than estimating visually.
Calculating Conductor Thermal Withstand Capacity
The K²S² Formula Explained
Every conductor has a maximum thermal energy it can absorb before insulation damage occurs. This limit is expressed by the adiabatic equation:
I²t ≤ K²S²
Where:
- I²t = Let-through energy from the protective device (A²s)
- K = Material and insulation constant (A·s½/mm²)
- S = Conductor cross-sectional area (mm²)
The constant K accounts for conductor material (copper or aluminum), insulation type (PVC, XLPE, EPR), initial temperature (typically 70°C for continuous operation), and final permissible temperature (160°C for PVC, 250°C for XLPE). IEC 60364-5-54 provides standardized K values.
Standard K Values for Common Conductors
| Conductor Material | Insulation Type | Initial Temp | Final Temp | K Value (A·s½/mm²) |
|---|---|---|---|---|
| Copper | PVC | 70°C | 160°C | 115 |
| Copper | XLPE/EPR | 90°C | 250°C | 143 |
| Copper | Mineral (PVC) | 70°C | 160°C | 115 |
| Aluminum | PVC | 70°C | 160°C | 76 |
| Aluminum | XLPE/EPR | 90°C | 250°C | 94 |
Practical Calculation Example
Scenario: Verify if a VIOX NSX160F breaker (36kA breaking capacity) adequately protects a 10mm² copper conductor with PVC insulation where the prospective fault current is 25kA.
Step 1: Find breaker I²t from manufacturer curve
- Prospective current: 25 kA
- From VIOX NSX160F datasheet curve: I²t = 6×10⁵ A²s
Step 2: Calculate cable thermal withstand
- K = 115 (copper PVC, from table above)
- S = 10 mm²
- K²S² = 115² × 10² = 1.32×10⁶ A²s
Step 3: Verify protection
- Breaker I²t (6×10⁵) < Cable K²S² (1.32×10⁶) ✓
- Safety margin: (1.32 – 0.6) / 1.32 = 54.5%
Conclusion: The cable is adequately protected with substantial safety margin.
Busbar Thermal Verification Using I²t
Why Busbars Require Special Consideration
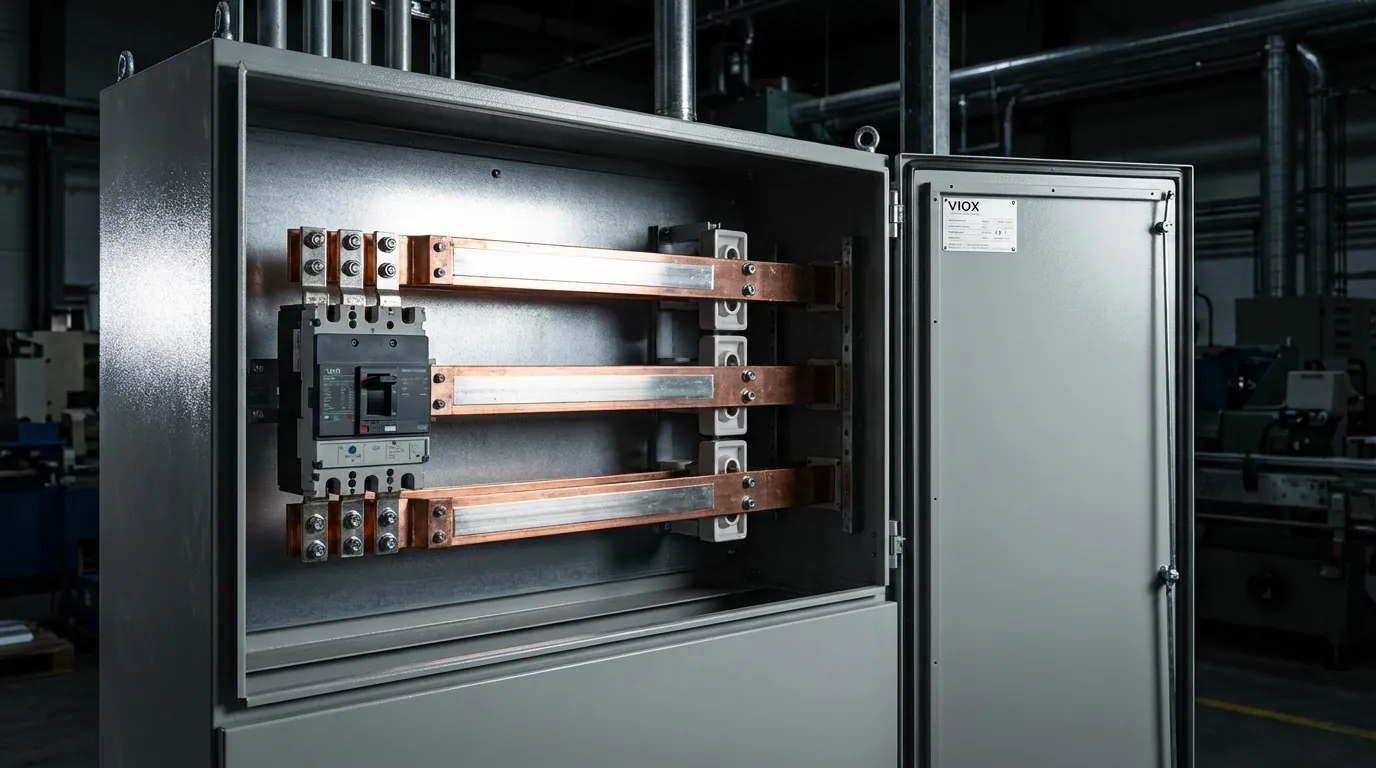
Busbars in distribution panels and switchgear face identical thermal stress as cables during faults, but their verification process differs slightly due to geometry and installation conditions. Copper or aluminum bars have excellent thermal conductivity, yet their compact arrangement in enclosed panels limits heat dissipation during the brief fault duration.
The same I²t principle applies, but engineers must account for the AC skin effect factor (Kf) and precise conductor dimensions. For rectangular copper busbars, the thermal withstand calculation becomes:
θk = θ0 + (I²t × Kf × ρ0) / (A² × c × γ × (1 + α0 × θ0))
Where:
- θk = Final temperature (°C)
- θ0 = Initial temperature (typically 70°C for continuous operation)
- I²t = Let-through energy (A²s)
- Kf = AC additional loss coefficient (typically 1.0-1.5 depending on frequency and bar dimensions)
- ρ0 = Resistivity at 0°C (1.65×10⁻⁸ Ω·m for copper)
- A = Cross-sectional area (m²)
- c = Specific heat capacity (395 J/(kg·K) for copper)
- γ = Density (8900 kg/m³ for copper)
- α0 = Temperature coefficient (1/235 K⁻¹ for copper)
Worked Example: Busbar Temperature Rise
Given: 100×10mm copper busbar, initial temperature 70°C, protected by 160A current-limiting breaker, prospective fault 100kA.
Step 1: Obtain breaker I²t
- From manufacturer curve: I²t = 0.48×10⁶ A²s
Step 2: Calculate final temperature
- A = 100mm × 10mm = 1000mm² = 1×10⁻³ m²
- Kf = 1.0 (conservative for this geometry)
- Using the formula above:
θk = 70 + (0.48×10⁶ × 1.0 × 1.65×10⁻⁸) / ((1×10⁻³)² × 395 × 8900 × (1 + 1/235 × 70))
θk ≈ 70.8°C
Result: The temperature rise is less than 1°C, demonstrating the effectiveness of current-limiting protection. Without current limitation, the same 100kA fault lasting 500ms would raise the busbar temperature to approximately 95°C—still within limits but with significantly reduced safety margin.
This dramatic difference explains why current-limiting breakers enable the use of smaller, more economical busbars in modern switchgear designs while maintaining safety standards.
Standards and Compliance Requirements
IEC 60947-2: The Foundation Standard
IEC 60947-2 governs low-voltage circuit breakers and mandates that manufacturers provide I²t curves for current-limiting devices. The standard specifies:
- Test conditions for determining let-through values
- Curve accuracy requirements (typically ±10% tolerance)
- Ambient temperature assumptions (40°C for industrial breakers)
- Coordination requirements between upstream and downstream devices
Breakers must demonstrate consistent I²t performance across their entire breaking capacity range, from minimum to rated short-circuit current.
Regional Standard Variations
| Region | Primary Standard | Key Differences |
|---|---|---|
| Europe | IEC 60947-2 | Direct I²t curves required in datasheets |
| North America | UL 489 | Let-through charts optional; coordination tables more common |
| China | GB 14048.2 | Based on IEC 60947-2 with minor modifications |
| Australia | AS/NZS 60947.2 | Identical to IEC with local installation requirements |
Cable Standards Integration
Conductor thermal withstand values (K factors) come from complementary standards:
- IEC 60364-5-54: Installation requirements and K values for fixed installations
- IEC 60502: Power cables with extruded insulation
- BS 7671: UK wiring regulations (harmonized with IEC)
Engineers must ensure both the protective device (per IEC 60947-2) and conductor sizing (per IEC 60364-5-54) are verified together for complete compliance.
Practical Application: Panel Design Workflow
Selection Process for New Installations
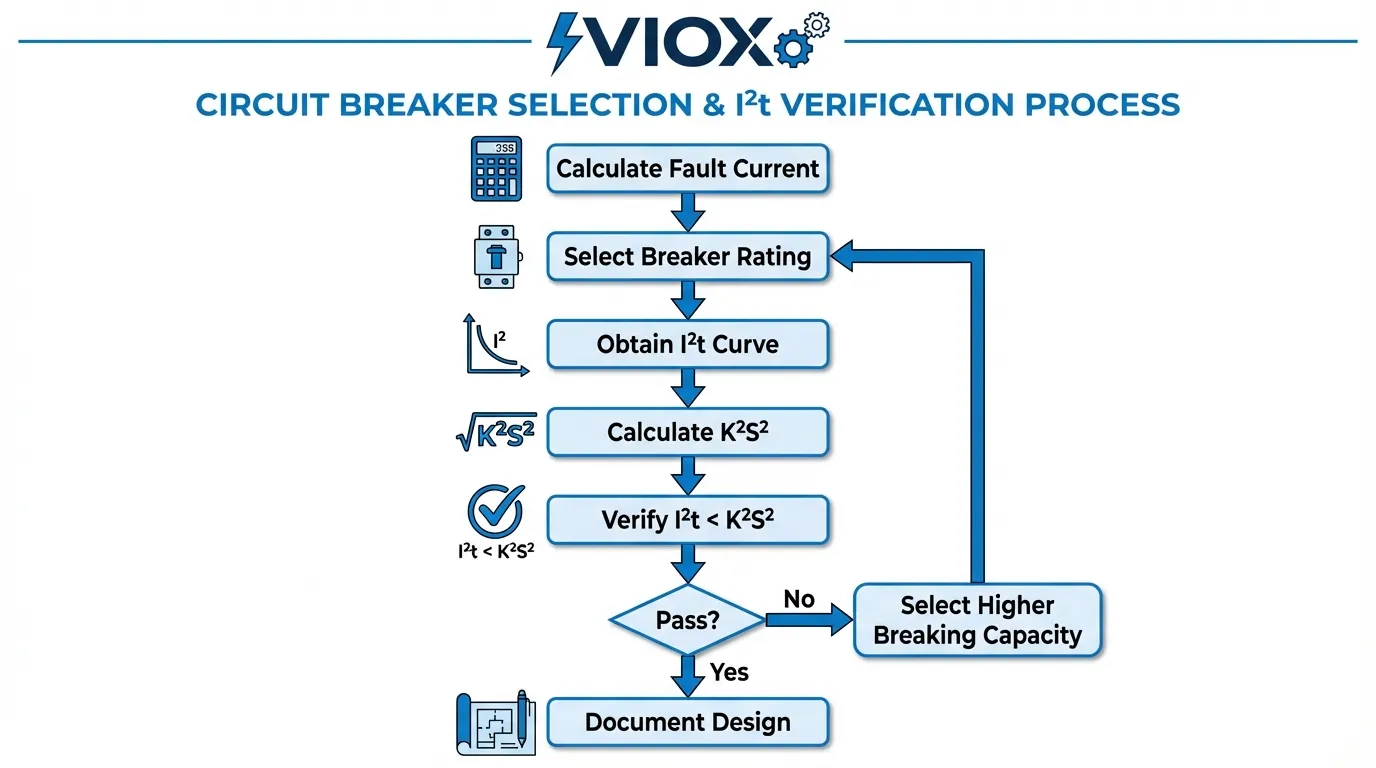
When designing an electrical distribution panel, follow this systematic workflow to ensure proper thermal protection:
Phase 1: System Analysis
- Calculate maximum prospective short-circuit current at each distribution point using system impedance data
- Identify all conductor types, sizes, and insulation materials in the installation
- Determine ambient temperature conditions and any derating factors
Phase 2: Protective Device Selection
- Select circuit breaker ratings based on load current requirements
- Verify breaking capacity exceeds prospective fault current
- Choose current-limiting type breakers where fault levels are high (>10kA) or conductors are small (<16mm²)
Phase 3: Thermal Verification
- Obtain I²t curves from breaker manufacturer for selected devices
- Calculate conductor thermal withstand capacity (K²S²) for each circuit
- Verify breaker I²t < conductor K²S² for prospective fault current
- Document safety margins (recommend minimum 20%)
Phase 4: Coordination Check
- Verify selectivity between upstream and downstream protective devices
- Ensure backup protection I²t values don’t exceed downstream conductor limits
- Review manufacturer coordination tables for device combinations
Retrofit and Upgrade Scenarios
Existing installations often require evaluation when load increases or fault levels change due to utility upgrades. The I²t verification process becomes critical:
Scenario: A facility adds a new transformer, increasing the available fault current from 15kA to 35kA at the main distribution board.
Analysis Required:
- Review existing breaker I²t curves at new fault level (35kA)
- Re-verify all downstream conductor thermal withstand
- Check if existing busbars remain adequate
- Evaluate need for current-limiting breakers if standard breakers now exceed conductor I²t limits
This analysis frequently reveals that existing standard breakers, while having adequate breaking capacity, allow excessive I²t at the higher fault level. Upgrading to current-limiting breakers often provides the most economical solution compared to replacing all undersized conductors.
Common Design Mistakes and How to Avoid Them
Mistake 1: Assuming All Breakers Are Current-Limiting
Problem: Not all circuit breakers provide significant current limitation. Standard thermal-magnetic breakers, particularly larger frame sizes (>630A), often have minimal current-limiting effect. Their I²t curves may show values only slightly below the unlimited fault energy.
Solution: Always verify the breaker type and obtain actual I²t curves from the manufacturer. Don’t assume current limitation based on breaking capacity alone. Current-limiting performance is a specific design feature, not an automatic characteristic of high breaking capacity.
Mistake 2: Using Peak Current Instead of RMS
Problem: Engineers sometimes confuse the peak let-through current (Ip) shown on limitation curves with the RMS current value needed for I²t calculations. This can lead to errors of 40% or more.
Solution: I²t curves always use RMS symmetrical prospective current on the X-axis. If you’ve calculated peak asymmetrical current, divide by √2 × κ (where κ is the peak factor, typically 1.8-2.0) to obtain the RMS value for curve reading.
Mistake 3: Ignoring Parallel Conductors
Problem: When multiple conductors are paralleled per phase (common in large installations), some engineers incorrectly multiply the K²S² value by the number of conductors. This is wrong because the fault current divides among the parallel paths, but the I²t energy affects each conductor individually.
Solution: For parallel conductors, verify that the breaker I²t is less than K²S² for a single conductor. The fault current division is already accounted for in the system impedance calculation that determined the prospective current.
Mistake 4: Neglecting Ambient Temperature Effects
Problem: The K values in standard tables assume specific initial temperatures (typically 70°C for continuous operation). Installations in hot environments (>40°C ambient) or with high load factors may have higher initial conductor temperatures, reducing thermal withstand capacity.
Solution: For elevated ambient temperatures or high load factors, either:
- Use adjusted K values from IEC 60364-5-54 Annex A
- Apply a temperature derating factor to the K²S² result
- Ensure the breaker I²t provides additional safety margin (>30%)
Advanced Topics: Energy Limitation and Arc Flash
I²t’s Role in Arc Flash Hazard Reduction
Arc flash incident energy calculations per IEEE 1584 traditionally use the breaker’s time-current curve to determine clearing time. However, for current-limiting breakers operating in their instantaneous region, this method significantly overestimates the actual incident energy.
Research has shown that using the I²t value to calculate arc flash energy provides more accurate results for current-limiting devices. The relationship is:
Incident Energy (cal/cm²) ∝ √(I²t) / D²
Where D is the working distance. This approach can reduce calculated incident energy by 50-70% compared to time-current curve methods, potentially lowering required PPE categories and improving worker safety.
Coordination and Selectivity Considerations
Proper selectivity requires that only the breaker closest to the fault operates, leaving upstream devices closed. From an I²t perspective, this means:
- Energy discrimination: The upstream breaker’s I²t at the fault location must exceed the downstream breaker’s total clearing energy
- Time discrimination: The upstream device must remain closed long enough for the downstream device to clear the fault
- Current discrimination: In some cases, the upstream device only sees reduced current due to the downstream device’s impedance
Manufacturers provide coordination tables showing which device combinations achieve selectivity, but understanding the underlying I²t relationships helps engineers make informed decisions when tables don’t cover specific scenarios.
Key Takeaways
- I²t curves quantify thermal energy that circuit breakers allow to pass during fault interruption, measured in ampere-squared seconds (A²s)
- Current-limiting breakers can reduce fault energy by 1000× or more compared to non-current-limiting devices, enabling smaller conductor sizes
- Reading I²t curves requires five steps: calculate prospective current, locate on X-axis, trace to breaker curve, read Y-axis value, compare with conductor withstand
- Conductor thermal withstand is calculated using K²S², where K depends on material and insulation type, and S is cross-sectional area
- Verification formula is simple: Breaker I²t must be less than conductor K²S² at the prospective fault current level
- Standards compliance requires following IEC 60947-2 for breakers and IEC 60364-5-54 for conductor sizing
- Common mistakes include confusing RMS/peak values, assuming all breakers are current-limiting, and neglecting ambient temperature effects
- Busbar verification uses the same I²t principle but requires additional calculations for temperature rise
- Arc flash calculations benefit from I²t data, often reducing incident energy estimates for current-limiting breakers
- Coordination and selectivity depend on proper I²t relationships between upstream and downstream protective devices
Frequently Asked Questions
Q: Can I use I²t curves for DC circuit breakers?
A: Yes, but with caution. DC breakers have I²t curves, but the current-limiting effect is generally less pronounced than AC breakers due to the absence of natural current zeros. Always use DC-specific curves and never apply AC breaker data to DC applications. Learn more about DC circuit breaker sizing.
Q: What if my prospective fault current falls below the curve’s starting point?
A: Most I²t curves begin at currents where current-limiting action starts (typically 3-5× rated current). Below this threshold, the breaker operates in its thermal or magnetic region without significant limitation. For these lower currents, use the time-current curve to calculate I²t as: I²t = I² × clearing time.
Q: How often should I re-verify I²t protection in existing installations?
A: Re-verification is required when: (1) utility upgrades increase available fault current, (2) conductors are replaced or circuits extended, (3) protective devices are changed, or (4) major loads are added. As a best practice, review during periodic electrical system studies (typically every 5 years). Understanding trip curves helps identify when changes affect protection.
Q: Do miniature circuit breakers (MCBs) have I²t curves?
A: Yes, MCBs per IEC 60898-1 have standardized maximum I²t values based on their breaking capacity (6kA, 10kA, etc.) and curve type (B, C, D). However, manufacturers don’t always publish detailed curves. For precise verification, request I²t data from the manufacturer or use the conservative maximum values from IEC 60898-1 Annex D. MCB breaking capacity comparison provides additional context.
Q: Can I interpolate between curves for different breaker ratings?
A: No, never interpolate between different breaker ratings on I²t curves. Each rating has unique internal characteristics that affect current limitation. If your required rating isn’t shown, request specific data from the manufacturer or use the next higher rating’s curve for conservative results.
Q: What’s the difference between I²t and Icw ratings on MCCBs?
A: Icw (short-time withstand current) is the current a breaker can carry for a specified time (typically 1 second) without tripping, used for coordination. I²t is the thermal energy the breaker lets through when it does trip. They serve different purposes: Icw for selectivity, I²t for conductor protection. MCCB short-time delay explained covers this distinction in detail.
Conclusion: Integrating I²t into Your Design Process
Understanding and properly applying circuit breaker I²t curves transforms thermal protection from a theoretical concern into a practical design tool. The verification process—reading curves, calculating conductor withstand, and confirming adequate margins—takes only minutes per circuit but prevents costly failures and safety hazards.
Modern electrical installations face increasing fault current levels as utility grids strengthen and distributed generation proliferates. Simultaneously, economic pressures drive conductor sizing toward minimum acceptable values. This convergence makes I²t verification not merely recommended but essential for safe, code-compliant designs.
VIOX Electric provides comprehensive I²t curves and technical support for all current-limiting circuit breakers in our product range. Our engineering team assists with thermal verification calculations and can recommend optimal breaker selections for challenging applications where fault levels approach conductor thermal limits.
For complex installations involving multiple coordination levels, busbar selection, or specialized applications like solar combiner boxes, consult with experienced electrical engineers who understand both the theoretical principles and practical application of I²t-based protection strategies.
The investment in proper thermal verification pays dividends through enhanced safety, reduced equipment damage during faults, lower insurance costs, and compliance with increasingly stringent electrical codes worldwide. Make I²t curve analysis a standard step in your circuit breaker selection process—your conductors, and your clients, will thank you.