Direct Answer: Silver consumption in the photovoltaic industry reached approximately 6,146 tons in 2024, accounting for 17% of global silver demand. However, soaring silver prices—which surged over 170% in 2025 to exceed $80 per ounce—are driving manufacturers toward “de-silvering” strategies. These include silver-coated copper pastes (reducing silver content by 50-80%), copper electroplating technologies, and advanced cell architectures like TOPCon and HJT. Leading manufacturers like LONGi and Aiko Solar are already achieving gigawatt-scale production of silver-free modules by early 2026.
Key Takeaways
Silver remains the backbone of solar cell electrode manufacturing due to its unmatched electrical conductivity, but the metal’s price volatility has become a critical cost pressure for photovoltaic manufacturers. The industry consumed 197.6 million ounces (approximately 6,146 tons) of silver in 2024, representing nearly one-third of global industrial silver demand.
The dramatic price surge—from mid-$20s per ounce in early 2024 to peaks above $84 in December 2025—has accelerated substitution efforts. Silver paste now accounts for 14-30% of total solar cell production costs, up from just 5% in 2023, forcing manufacturers to prioritize de-silvering innovations.
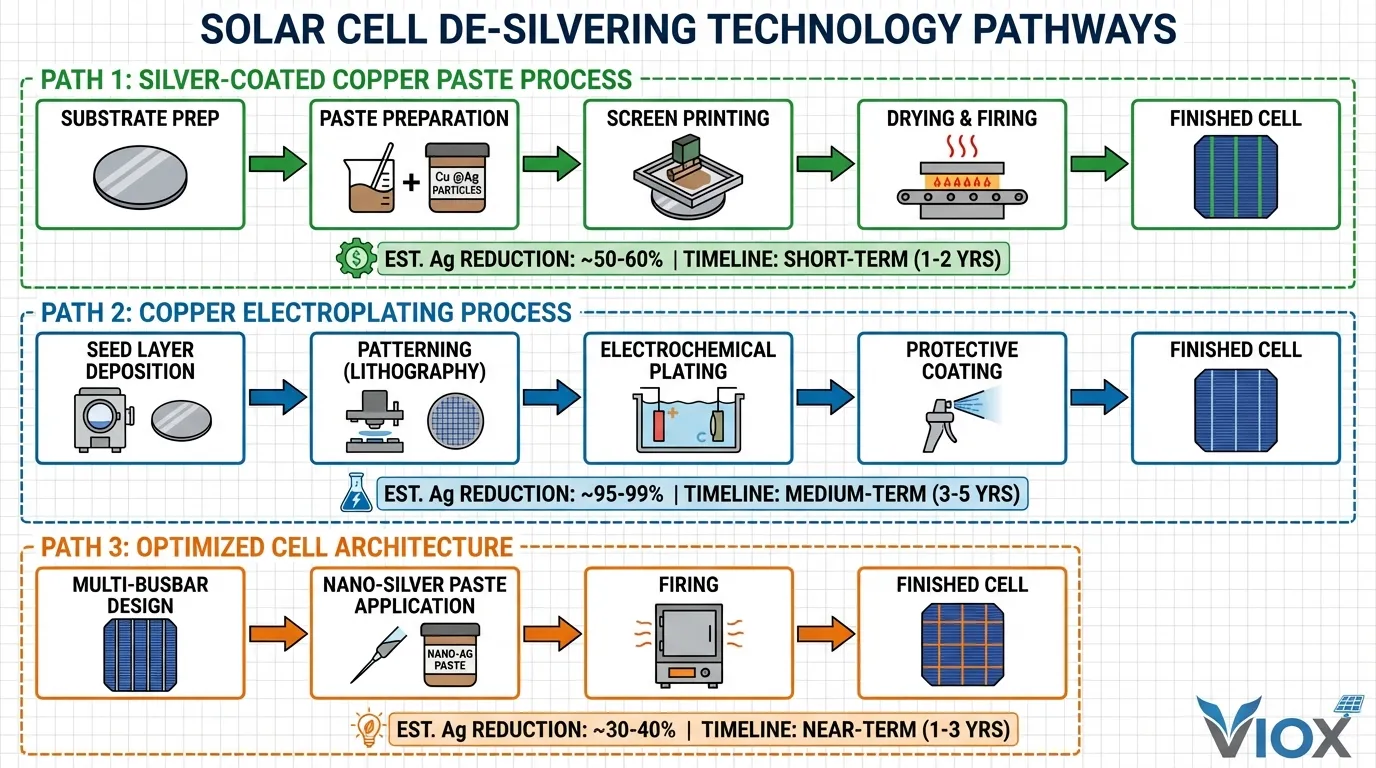
Three primary pathways are emerging to address silver dependency:
- Silver-coated copper pastes offer an immediate solution, reducing silver content to 15-30% while maintaining compatibility with existing screen-printing infrastructure.
- Copper electroplating represents a more radical approach, eliminating silver entirely through semiconductor-grade deposition techniques, though it requires significant capital investment in new production lines.
- Optimized cell architectures—particularly heterojunction (HJT) and back-contact (BC) designs—enable lower-temperature processing that facilitates copper integration while improving overall efficiency.
Major manufacturers have already begun large-scale deployment. LONGi Green Energy confirmed plans for mass production of copper-metallized back-contact cells in Q2 2026, while Aiko Solar has scaled 10 gigawatts of silver-free “ABC” modules. Industry analysts project that if copper metallization captures 50% market share by 2030, silver demand from solar could decrease by 260 million ounces annually.
Why Silver Dominates Photovoltaic Manufacturing
Silver’s role in solar cell production stems from a unique combination of physical properties that remain unmatched by alternative materials. With the highest electrical conductivity of all metals (63.0 × 10⁶ S/m at 20°C), silver enables efficient electron collection and transport across the solar cell surface with minimal resistive losses.
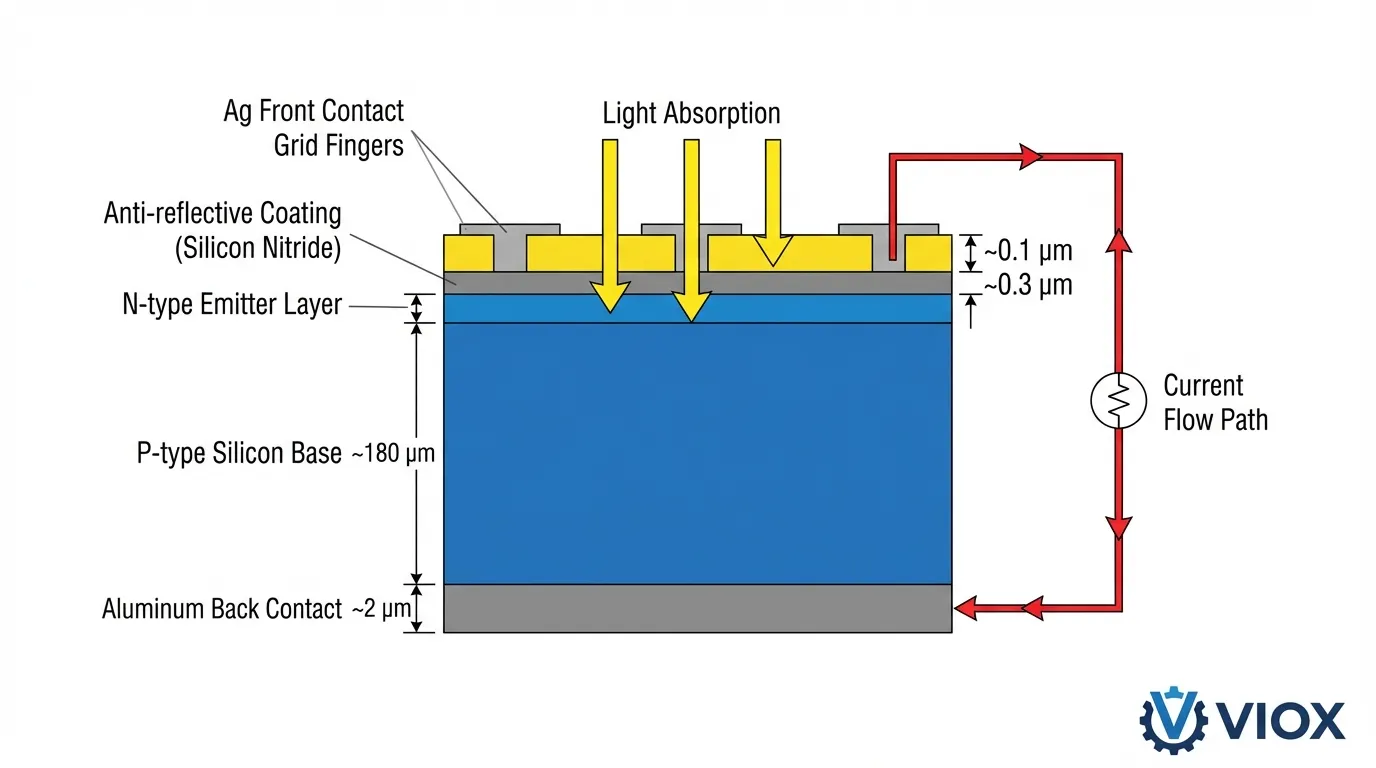
The metallization process for crystalline silicon solar cells relies on silver paste—a composite material containing ultra-fine silver particles (typically 0.5-2 micrometers), glass frit, and organic binders. During the high-temperature firing process (700-900°C for traditional cells), the glass frit etches through the anti-reflective silicon nitride layer, allowing silver particles to make direct ohmic contact with the silicon substrate. This “fire-through” capability enables cost-effective screen-printing manufacturing while achieving contact resistances below 1 mΩ·cm².
Beyond conductivity, silver’s optical properties contribute to overall panel performance. The metal’s high reflectivity (>95% across the solar spectrum) minimizes light absorption in the front-side grid fingers, directing more photons into the active silicon layer. Silver’s resistance to oxidation and corrosion ensures long-term stability in outdoor environments, supporting the industry’s 25-30 year warranty standards.
Silver Consumption by Cell Technology
The photovoltaic industry’s silver intensity has evolved significantly with technological transitions:
- P-type PERC technology: approximately 100-110 milligrams of silver per cell
- TOPCon cells: 80-90 milligrams per cell
- Heterojunction (HJT) designs: 70-75 milligrams
- Back-contact (BC) cells: up to 135 milligrams
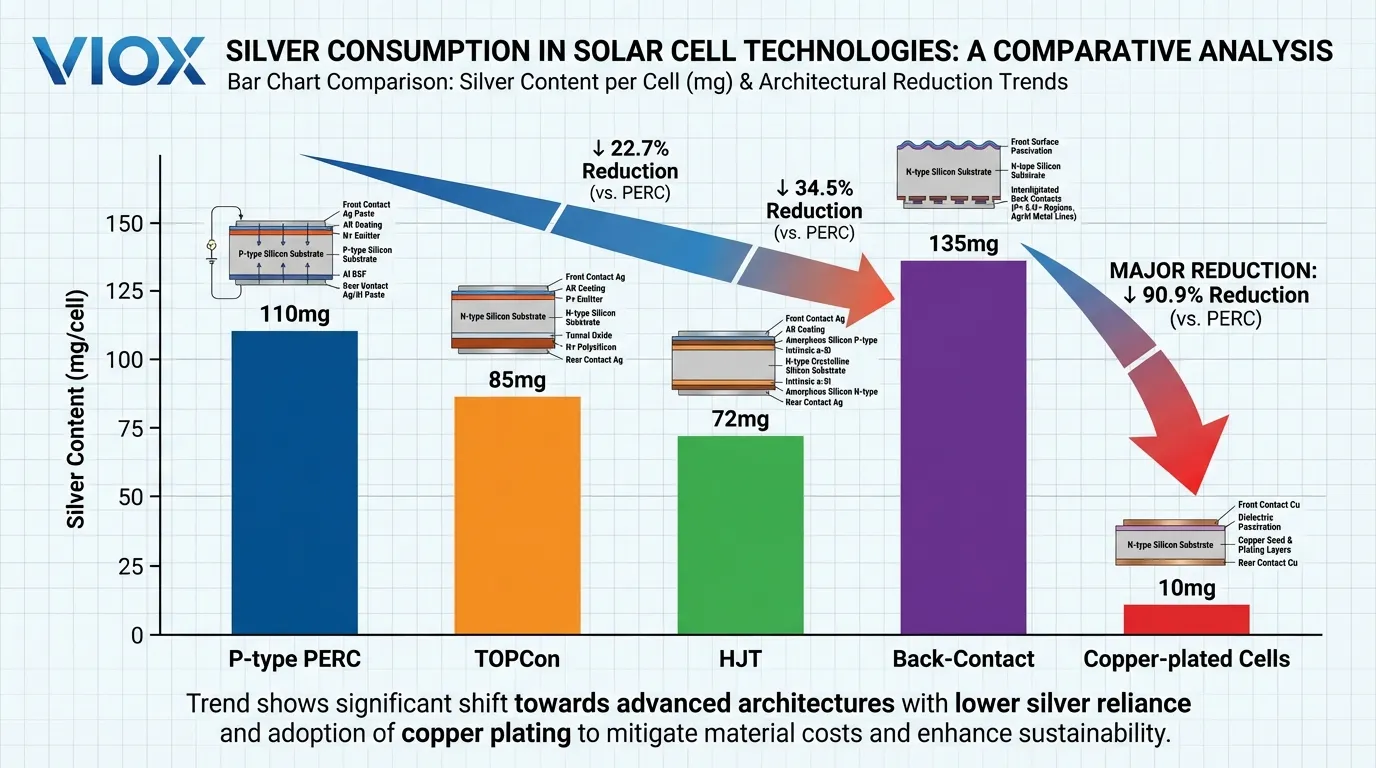
Although these figures represent reductions from earlier iterations, the absolute consumption remains substantial when multiplied across global production volumes exceeding 700 gigawatts of annual cell manufacturing capacity.
The Supply Vulnerability
The solar sector’s dependence on silver creates a structural vulnerability. Unlike copper or aluminum, approximately 72% of silver production occurs as a byproduct of lead, zinc, and copper mining. This means silver supply growth is constrained by the economics of other metal markets, limiting the industry’s ability to scale production in response to photovoltaic demand.
Primary silver mine output has stagnated at approximately 813 million ounces annually, while total silver demand reached 1.16 billion ounces in 2024, creating persistent supply deficits that have now extended for five consecutive years.
The Silver Price Crisis and Its Impact on Solar Economics
The silver market experienced an unprecedented transformation throughout 2024-2025, fundamentally altering the cost structure of photovoltaic manufacturing. After trading in a relatively stable $20-25 per ounce range for several years, silver prices began accelerating in mid-2024. By December 2025, spot prices had surged past $84 per ounce—a 170% increase that far outpaced even gold’s impressive 73% gain over the same period.
Cost Pressure on Manufacturers
This price explosion created immediate cost pressures across the solar supply chain. Silver paste, which represented just 5% of total cell production costs in 2023, ballooned to 14-30% by late 2025, depending on cell technology and paste formulation.
For TOPCon cell manufacturers, the impact was particularly severe: while cell prices increased approximately 30% from their December 2025 lows, this barely kept pace with silver cost inflation. Module producers faced even tighter margins, creating a severe margin compression that threatened profitability across the industry.
Structural Demand Factors
Industrial fabrication demand reached a record 680.5 million ounces in 2024, with photovoltaics alone consuming 197.6 million ounces—nearly 29% of industrial usage. This concentration of demand in a single sector creates price inelasticity, as solar manufacturers cannot easily reduce consumption without sacrificing production volumes.
Meanwhile, global solar installation targets continue accelerating, with the International Energy Agency projecting 4,000 gigawatts of new capacity additions through 2030, potentially pushing solar’s share of total silver demand above 20%.
Supply Constraints
Supply-side constraints compound these demand pressures:
New silver mining projects require 5-8 years from discovery to production, making it impossible for primary supply to respond quickly to price signals. The byproduct nature of most silver production means output is governed by copper, lead, and zinc market cycles rather than silver prices directly.
Geopolitical factors have further tightened physical markets, with China—which accounts for approximately 70% of global solar manufacturing capacity—implementing export restrictions on refined silver in 2025, exacerbating liquidity challenges and triggering sharp price volatility.
The Strategic Imperative
For solar manufacturers operating on historically thin margins (typically 5-15% for module producers), the silver cost surge represents an existential threat. A $10 per ounce increase in silver prices translates to approximately $0.02-0.03 per watt in additional cell costs, which can eliminate profitability entirely in competitive markets where module prices have fallen below $0.15 per watt.
This economic pressure has created a clear strategic imperative: manufacturers must either pass costs to customers (risking market share loss), accept compressed margins (threatening long-term viability), or fundamentally redesign their metallization processes to reduce or eliminate silver dependency.
De-Silvering Technologies: From Incremental Thrifting to Complete Substitution
The solar industry’s response to silver price pressures encompasses three distinct technological pathways, each offering different trade-offs between implementation speed, capital requirements, and silver reduction potential.
Silver-Coated Copper Paste: The Immediate Solution
Silver-coated copper (Cu @Ag) paste represents the most rapidly deployable de-silvering technology, offering 50-80% silver reduction while maintaining compatibility with existing screen-printing infrastructure. In this approach, copper particles are coated with a thin silver shell (typically 15-30% silver by weight), creating a composite material that leverages copper’s lower cost while preserving silver’s superior surface properties.
Technical Challenge: The technical challenge lies in preventing copper oxidation during the high-temperature firing process required for contact formation. At temperatures above 700°C, copper readily oxidizes, forming copper oxide layers that dramatically increase contact resistance and reduce cell efficiency. The silver coating acts as a protective barrier, but maintaining shell integrity under thermal stress requires precise control.
HJT Cell Application: For heterojunction (HJT) cells, which process at lower temperatures (180-250°C), silver-coated copper paste has achieved particularly strong adoption. The reduced thermal stress minimizes silver shell degradation and copper diffusion risks, allowing silver content to be reduced to 15-20% while maintaining efficiency comparable to pure silver pastes.
TOPCon Cell Application: TOPCon cells present greater challenges due to their higher firing temperatures (typically 700-850°C). Manufacturers have developed “dual-layer” paste architectures: a thin silver seed layer is first printed and fired to establish ohmic contact and create a copper diffusion barrier, followed by a thick Cu @Ag layer that provides bulk conductivity. This approach enables silver consumption reduction exceeding 50%.
Economic Case: With silver at $80 per ounce and copper at $4 per pound, a 70% reduction in silver content translates to approximately $0.015-0.020 per watt in material cost savings—sufficient to restore profitability for many manufacturers. Capital requirements are minimal, as existing screen-printing lines require only paste formulation changes and minor firing profile adjustments. Cu @Ag paste adoption is projected to reach 30-40% of global cell production by 2027.
Copper Electroplating: The Radical Transformation
Copper electroplating represents a fundamentally different approach that eliminates silver entirely by borrowing semiconductor fabrication techniques. Instead of printing and firing metal paste, this method deposits copper through electrochemical processes, achieving fine-line metallization with superior conductivity and mechanical properties.
Process Overview: The process begins with deposition of a thin seed layer (typically copper or nickel, 50-200 nanometers thick) through physical vapor deposition (PVD) or sputtering. This seed layer is then patterned using photolithography or laser ablation to define the grid finger geometry. The patterned substrate is immersed in an electrolyte bath containing copper ions, where an applied current drives copper deposition selectively onto the seed layer, building up grid fingers to the desired height (typically 15-30 micrometers).
Technical Advantages: Electroplated copper fingers can be made narrower (down to 20-30 micrometers versus 40-60 micrometers for screen-printed paste) with higher aspect ratios, reducing shading losses while maintaining low series resistance. The pure copper structure exhibits bulk resistivity of 1.7 μΩ·cm—approximately 40% lower than fired silver paste—enabling longer fingers and larger cell formats without efficiency penalties.
Challenges: However, electroplating introduces significant complexity and cost. The capital investment for a complete plating line ranges from $15-25 million per gigawatt of capacity—approximately 3-4 times higher than screen-printing equipment. Process control requirements are stringent, as variations in seed layer uniformity, plating current density, or electrolyte composition can cause defects that reduce yield.
The “Copper Poisoning” Problem: Copper atoms readily diffuse into silicon at elevated temperatures, creating deep-level defects that act as recombination centers and severely degrade cell efficiency. The breakthrough enabling modern copper plating came with advanced cell architectures—particularly heterojunction (HJT) and back-contact (BC) designs—that incorporate transparent conductive oxide (TCO) layers or specialized passivation stacks that act as effective copper diffusion barriers.
Commercial Deployment: Leading manufacturers have demonstrated the commercial viability of copper electroplating at scale. Aiko Solar’s “ABC” (All-Back-Contact) modules, which utilize copper plating exclusively, have reached 10 gigawatts of cumulative production capacity. LONGi Green Energy announced plans for mass production of copper-plated back-contact cells beginning in Q2 2026, with efficiency targets exceeding 26%.
Optimized Cell Architectures and Process Innovations
Beyond direct material substitution, cell design innovations are reducing silver intensity through improved current collection efficiency and optimized metallization patterns.
Multi-Busbar (MBB) and Zero-Busbar Designs: These replace traditional 3-5 busbar layouts with 9-16 thin busbars or eliminate busbars entirely in favor of wire-based interconnection. These approaches distribute current collection more uniformly, allowing finger pitch to be increased (reducing total finger length) while maintaining low series resistance. The result is 10-20% reduction in total metallization area and corresponding silver consumption.
Nano-Silver Pastes: Advanced paste formulations using particles below 100 nanometers in diameter achieve better packing density and lower firing temperatures, enabling thinner print layers without sacrificing conductivity. Some manufacturers have reduced silver loading to below 14 milligrams per watt using nano-silver combined with optimized glass frit compositions.
Market Dynamics and Industry Transformation
The de-silvering transition is reshaping competitive dynamics across the solar value chain, creating winners and losers based on technological positioning and capital access. Manufacturers that successfully deploy copper-based metallization gain significant cost advantages, enabling aggressive pricing strategies that pressure competitors still dependent on silver paste.
Leading Manufacturers’ Advantage
Leading integrated manufacturers—those controlling both cell and module production—are best positioned to capture de-silvering benefits. Companies like LONGi, Jinko Solar, and Trina Solar can amortize the substantial capital investments required for electroplating lines across large production volumes while optimizing cell-module integration to maximize efficiency gains.
Challenges for Smaller Manufacturers
Smaller Tier-2 and Tier-3 manufacturers face more difficult choices. The capital intensity of copper electroplating—$15-25 million per gigawatt—represents a prohibitive barrier for many firms. For these players, silver-coated copper paste offers a more accessible pathway, requiring minimal capital investment while delivering meaningful cost relief.
Supply Chain Disruption
The equipment and materials supply chain is also experiencing significant disruption. Screen-printing equipment manufacturers face declining demand as electroplating gains share. Conversely, specialized plating equipment suppliers like Suzhou Maxwell Technologies are securing massive order backlogs, with some reporting revenue growth exceeding 200% year-over-year.
Geographic Implications
China’s dominance in solar manufacturing positions it to lead the de-silvering transition. With approximately 70% of global cell production capacity and strong government support for technology upgrades, Chinese manufacturers can deploy new metallization technologies at scale more rapidly than competitors in other regions.
Impact on Silver Markets
If copper metallization captures 10% of global cell production by 2027, 30% by 2028, and 50% by 2030, solar silver demand could decline from approximately 200 million ounces in 2025 to 100 million ounces by 2030. This would represent a dramatic reversal of the growth trend that has characterized the past decade.
Silver Recovery and Circular Economy Opportunities
As the installed base of solar panels grows—approaching 2 terawatts of cumulative global capacity by 2026—end-of-life module recycling is emerging as a significant secondary silver source. Each retired panel contains approximately 15-25 grams of silver, representing substantial value at current prices.
Current Recycling Status
Current recycling rates remain low, with estimates suggesting less than 10% of retired panels enter formal recycling channels. The primary barrier is economic: disassembly, separation, and refining processes are labor-intensive and energy-intensive. However, at prices above $50 per ounce, the economics shift dramatically.
Advanced Recycling Technologies
Thermal delamination processes use controlled heating to separate the encapsulant layers, allowing mechanical removal of cells from glass and frames. Chemical leaching then dissolves the silver from cell surfaces, with electrolytic refining producing high-purity silver suitable for reuse in paste manufacturing. Some facilities report silver recovery rates exceeding 95%.
Regulatory Support
The European Union’s Circular Economy Action Plan mandates improved recovery of precious metals from electronic waste, including solar panels, with specific targets for collection rates and material recovery percentages. China has implemented extended producer responsibility (EPR) frameworks requiring manufacturers to fund end-of-life management.
Future Projections
By 2030, cumulative retired panel volume in China alone could reach 18 gigawatts (approximately 1.5 million tons), containing roughly 270-450 tons of recoverable silver. By 2050, global retired capacity may exceed 250 gigawatts, with silver content potentially reaching 3,750-6,250 tons—equivalent to 10-15% of current annual silver mine production.
Future Outlook: Toward a Silver-Independent Solar Industry
The convergence of technological maturity, economic pressure, and strategic necessity is driving the solar industry toward fundamental independence from silver within the next decade. While complete elimination remains unlikely, the mainstream manufacturing base is clearly transitioning to copper-dominant metallization.
Accelerated Timeline
Industry roadmaps published in 2023 anticipated gradual silver reduction through incremental thrifting, with copper electroplating reaching 10-15% market share by 2030. However, the dramatic price surge of 2024-2025 has compressed this timeline significantly. Current deployment announcements suggest copper-based metallization could reach 30-40% of global production by 2027-2028, with potential for majority market share by 2030.
Critical Success Factors
Technical Performance Validation: Technical performance must be validated through long-term field testing, as the solar industry’s 25-30 year warranty standards require confidence in reliability under diverse environmental conditions. Copper’s susceptibility to oxidation and corrosion remains a concern that will only be resolved through extended outdoor exposure data.
Capital Availability: The substantial investment required for electroplating lines creates barriers for smaller manufacturers and may slow transition in markets with limited access to low-cost capital. However, the compelling economics of copper metallization at current silver prices suggest that manufacturers unable to transition may face existential threats.
Policy and Regulatory Factors: Some markets may require extended field validation or certification processes before approving copper-metallized modules for utility-scale installations or subsidy programs. Conversely, government support for domestic manufacturing capacity could accelerate copper electroplating deployment by subsidizing capital investments.
Broader Implications
Silver’s role as a critical material for clean energy transitions has been a central narrative supporting investment demand and price appreciation. If solar consumption peaks and declines as projected, silver’s strategic importance may diminish, potentially affecting long-term price trajectories. However, growing demand from electric vehicles, electronics, and emerging applications like antimicrobial coatings may sustain overall industrial consumption.
Industry Transformation
For solar manufacturers, the de-silvering transition represents both challenge and opportunity. Those that successfully navigate the technological and capital requirements will emerge with sustainable cost structures independent of precious metal volatility, positioning them for long-term competitiveness. Those that fail to adapt risk margin compression and potential obsolescence. The next five years will likely determine which manufacturers survive and thrive in the post-silver solar era.
Comparison Table: Silver Content by Solar Cell Technology
| Cell Technology | Silver Content (mg/cell) | Silver Content (mg/W) | Typical Efficiency | De-Silvering Compatibility | Market Share 2025 |
|---|---|---|---|---|---|
| P-type PERC | 100-110 | 18-20 | 22-23% | Moderate (Cu @Ag paste) | 35% |
| N-type TOPCon | 80-90 | 15-17 | 24-25% | Good (Cu @Ag paste, dual-layer) | 45% |
| Heterojunction (HJT) | 70-75 | 12-14 | 25-26% | Excellent (Cu @Ag paste, Cu plating) | 12% |
| Back-Contact (BC) | 130-135 | 20-22 | 26-27% | Excellent (Cu plating) | 5% |
| Cu-Plated HJT | 0-15 | 0-3 | 25-26% | Complete (silver-free) | 2% |
| Cu-Plated BC | 0-10 | 0-2 | 26-27% | Complete (silver-free) | 1% |
Note: Silver content varies by manufacturer and specific cell design. Figures represent industry averages for 2025 production.
De-Silvering Technology Comparison
| Technology | Silver Reduction | Capital Investment | Implementation Timeline | Technical Maturity | Primary Cell Compatibility |
|---|---|---|---|---|---|
| Silver-Coated Copper Paste (Cu @Ag) | 50-80% | Low ($1-3M/GW) | 6-12 months | Commercial | All cell types |
| Dual-Layer Paste (Seed + Cu @Ag) | 50-70% | Low ($2-4M/GW) | 12-18 months | Commercial | TOPCon, PERC |
| Copper Electroplating | 95-100% | High ($15-25M/GW) | 24-36 months | Early Commercial | HJT, BC |
| Optimized Grid Design (MBB/Zero-BB) | 10-20% | Moderate ($3-6M/GW) | 12-18 months | Commercial | All cell types |
| Nano-Silver Paste | 15-25% | Low ($1-2M/GW) | 6-12 months | Commercial | All cell types |
Capital investment figures represent incremental costs for retrofitting existing production lines or greenfield deployment.
FAQ Section
Q: Why can’t solar manufacturers simply switch to copper immediately?
A: Copper faces two critical technical barriers: oxidation at high temperatures and “copper poisoning” of silicon. When exposed to the 700-900°C firing temperatures required for traditional cell processing, copper rapidly forms copper oxide, which has poor conductivity. Additionally, copper atoms diffuse into silicon at elevated temperatures, creating defects that reduce cell efficiency by 20-50%. Advanced cell architectures like HJT and back-contact designs solve these problems through low-temperature processing and diffusion barrier layers, but these technologies require completely new production equipment and represent only 15-20% of current global capacity.
Q: How much does silver price increase affect solar panel costs?
A: At current consumption levels (approximately 20 grams per panel), a $10 per ounce increase in silver prices adds roughly $6-7 to the cost of a typical 400-watt residential panel. With silver prices rising from $25 to $80+ per ounce over 2024-2025, this represents approximately $35-40 in additional cost per panel, or $0.09-0.10 per watt. For utility-scale projects with modules priced around $0.15-0.20 per watt, this represents a 45-65% increase in material costs, severely compressing manufacturer margins.
Q: Will recycled silver from old panels solve the supply problem?
A: Not in the near term. While each retired panel contains 15-25 grams of recoverable silver, the volume of panels reaching end-of-life remains relatively small—approximately 1-2 million tons globally by 2030, containing perhaps 300-500 tons of silver. This represents only 1-2% of annual global silver supply. By 2050, when cumulative retired capacity reaches 200+ gigawatts, recycled silver could provide 3,000-5,000 tons annually (approximately 10-15% of current mine production), but this timeline extends well beyond the current supply crisis.
Q: What happens to silver prices if solar demand decreases?
A: Solar currently represents approximately 17-20% of total silver demand and nearly 30% of industrial demand. If copper metallization reduces solar silver consumption by 50% over 5 years, this would remove approximately 100 million ounces from annual demand—roughly 10% of total global consumption. However, growing demand from electric vehicles (projected to triple by 2030), electronics, and medical applications may partially offset this decline. Most analysts expect silver prices to moderate from 2025 peaks but remain elevated relative to pre-2024 levels due to persistent industrial demand and ongoing supply constraints.
Q: Which solar cell technology will dominate by 2030?
A: Industry consensus suggests TOPCon will maintain plurality market share (40-50%) through 2030 due to its balance of efficiency, cost, and manufacturing compatibility with existing equipment. However, heterojunction (HJT) and back-contact technologies are projected to grow from current 15-20% combined share to 30-40% by 2030, driven primarily by their superior compatibility with copper metallization and higher efficiency potential. The key variable is whether copper electroplating achieves projected cost parity with silver-based TOPCon; if so, HJT/BC growth could accelerate beyond current projections.
Q: Are there any alternatives to both silver and copper?
A: Researchers are exploring several options, including aluminum, nickel, and conductive polymers, but none currently match silver or copper’s combination of conductivity, processability, and cost. Aluminum has been used for rear-side contacts but suffers from high contact resistance and poor solderability for front-side applications. Nickel requires complex plating processes and has lower conductivity than copper. Conductive polymers remain in early research stages with conductivity orders of magnitude below metals. For the foreseeable future, the choice remains between silver-based pastes, silver-copper composites, and pure copper metallization.
Related Links
- Learn more about solar combiner box design and protection
- Understand DC circuit breaker requirements for photovoltaic systems
- Explore junction box specifications for solar panel connections
- Discover surge protection strategies for solar installations
- Review electrical panel components for renewable energy systems
About VIOX Electric: As a leading B2B manufacturer of electrical equipment, VIOX Electric provides comprehensive solutions for solar energy systems, including DC circuit breakers, surge protection devices, combiner boxes, and distribution panels. Our products meet international standards (IEC, UL, CE) and support the global transition to renewable energy with reliable, cost-effective electrical protection and control equipment.