Introduction: The Silent Threat Before Failure
An ATS sits dormant in your switchgear, waiting. When the main power fails and your generator kicks in, it transfers the load in milliseconds. That’s when 200 amps flow through contacts the size of a fingernail. And if those contacts have quietly degraded over months of subtle contamination and micro-arcing, they won’t just transfer—they’ll weld themselves shut, trapping your facility on generator power indefinitely, unable to return to the grid.
This scenario plays out because technicians rarely see the warning signs. Unlike a circuit breaker that trips visibly, thermal failure in ATS contacts is invisible until it’s catastrophic. The culprit is contact resistance—a physics phenomenon most maintenance teams never measure and few understand. This guide reveals the underlying mechanisms and gives you a practical diagnostic strategy to prevent failure before it happens.
Contact Resistance Physics: Understanding a-Spots
Electrical contacts aren’t smooth, even when polished. Under a scanning electron microscope, both surfaces are jagged peaks and valleys. When you press two contacts together, they only touch at the highest peaks—called a-spots (asperity spots). These tiny contact points may occupy just 1% of the apparent contact surface.
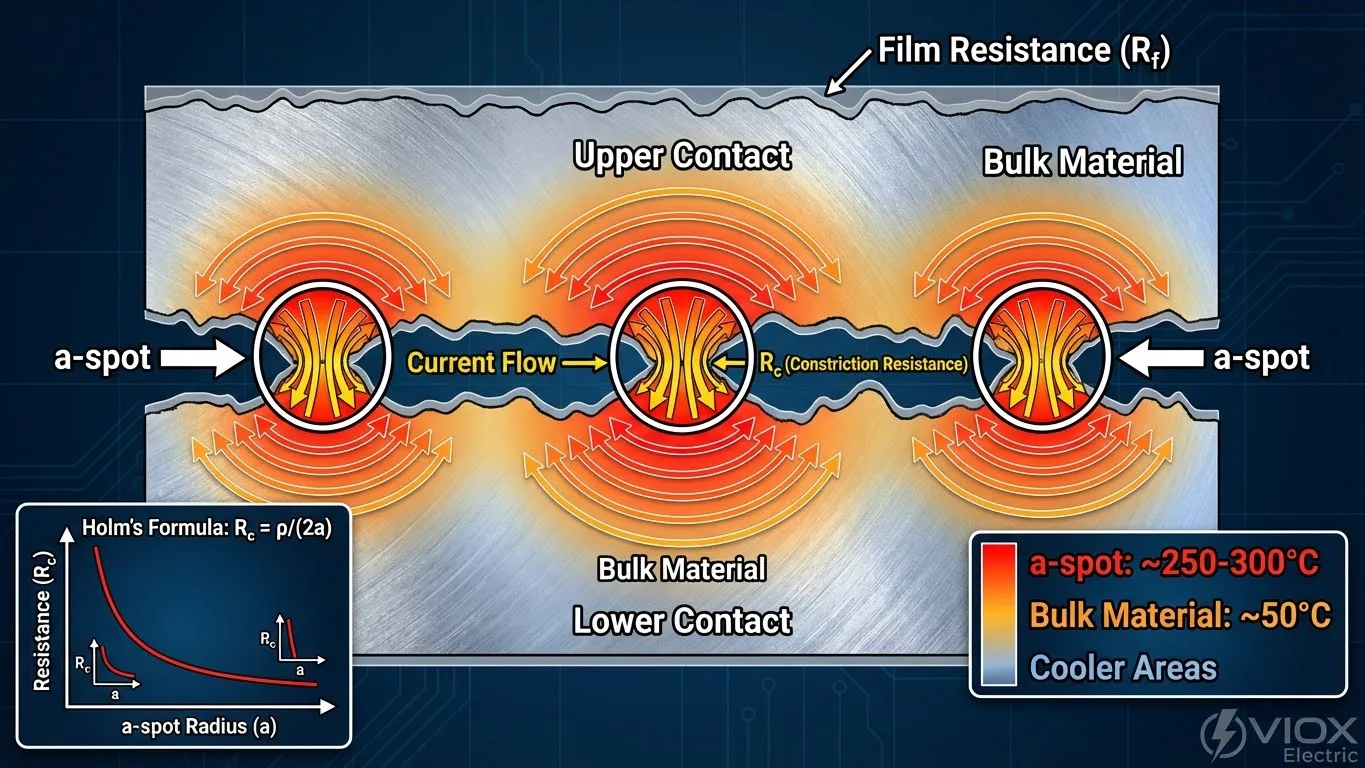
Why does this matter? Current must squeeze through these minuscule a-spots, causing constriction resistance—local resistance far exceeding what bulk conductivity would predict. The relationship follows Holm’s formula:
Where $\rho$ is material resistivity and $a$ is the radius of each a-spot. Smaller spots = higher resistance. Reduce the a-spot radius by half, and resistance quadruples.
On top of constriction resistance, contacts accumulate thin films: silver sulfide (from atmospheric sulfur), oxides, dust, and moisture. These insulating layers add film resistance ($R_f$), requiring electrons to tunnel through or break through the barrier. Together, $R_c + R_f$ can exceed 100 micro-ohms (µΩ)—millions of times higher than the bulk wire resistance.
The temperature coefficient accelerates this problem. For silver and copper, resistivity increases ~0.4% per degree Celsius. At an a-spot running 200°C above ambient, the local resistivity is 30% higher than at room temperature, further strangling current flow.
Root Causes of Overheating: Why Contacts Degrade
High contact resistance doesn’t appear overnight. It’s a progressive degradation driven by five converging factors:
1. Silver Sulfidation
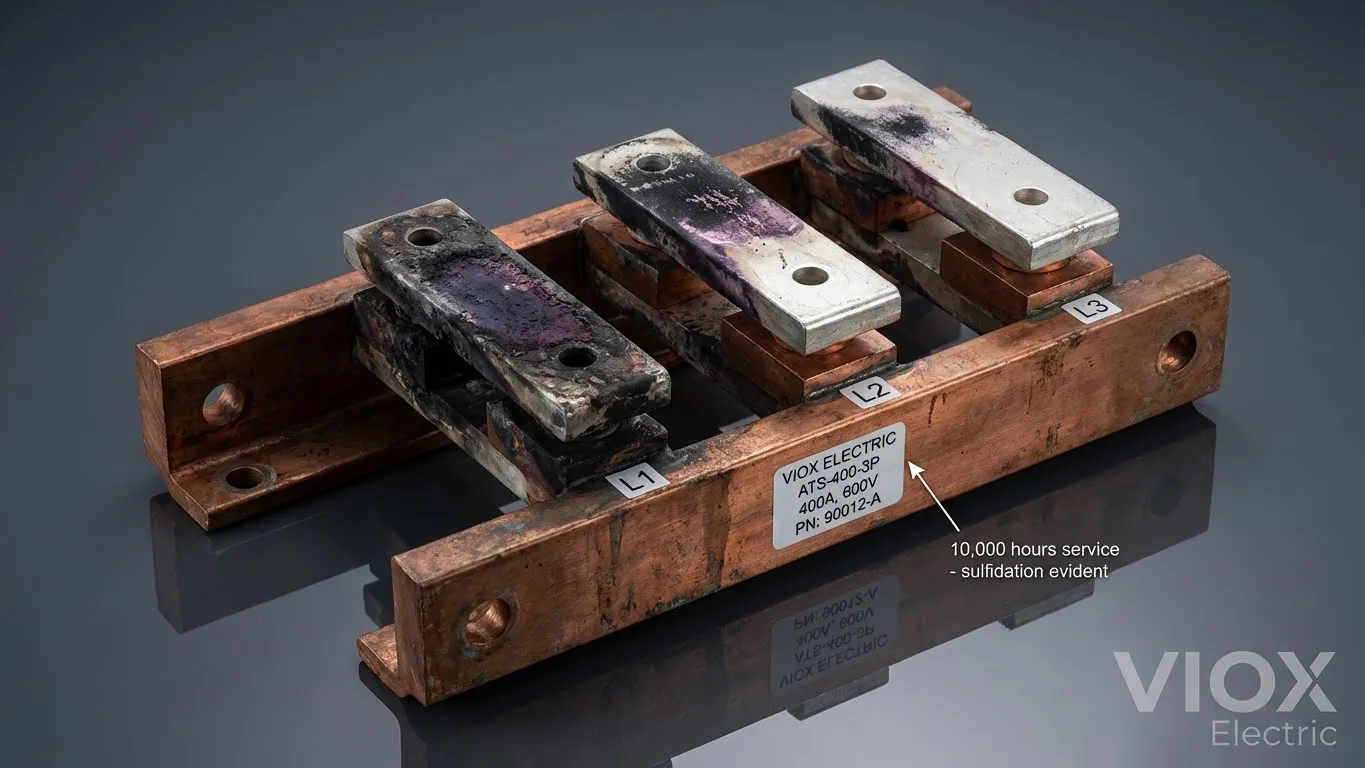
Silver is a superior conductor, but sulfur in industrial air converts it to silver sulfide ($Ag_2S$)—an insulator. Unlike silver oxide (which conducts somewhat), silver sulfide dramatically raises film resistance. In coastal or chemical plants, sulfidation accelerates.
2. Contact Pitting and Erosion
Every ATS transfer under load involves an electrical arc between separating contacts. Arcing vaporizes microscopic amounts of contact material, leaving a pitted, rough surface with fewer a-spots and lower contact force distribution. After thousands of transfers, the contact surface degrades into a Swiss cheese texture.
3. Loose Connections and Reduced Contact Force
Vibration from the switching mechanism or thermal cycling (repeated expansion/contraction) can loosen bolts or deform the contact springs. Reduced contact force ($F$) directly increases constriction resistance (empirically, $R_c \propto F^{-1}$). A worn spring contributes as much to heating as sulfidation.
4. Environmental Contamination
Dust, salt spray (in marine environments), and chlorides infiltrate enclosures, creating hygroscopic films that trap moisture. These films act as insulators, raising film resistance beyond acceptable limits.
5. Inadequate Lubrication
The solenoid-driven mechanism relies on proper lubrication to develop full closing force. Dried lubricant or dust in the pivot points reduces the force delivered to the contacts, mimicking a loose connection.
Temperature Rise Analysis: The Feedback Loop
The heating process in ATS contacts isn’t linear—it’s a positive feedback system that can spiral into thermal runaway:
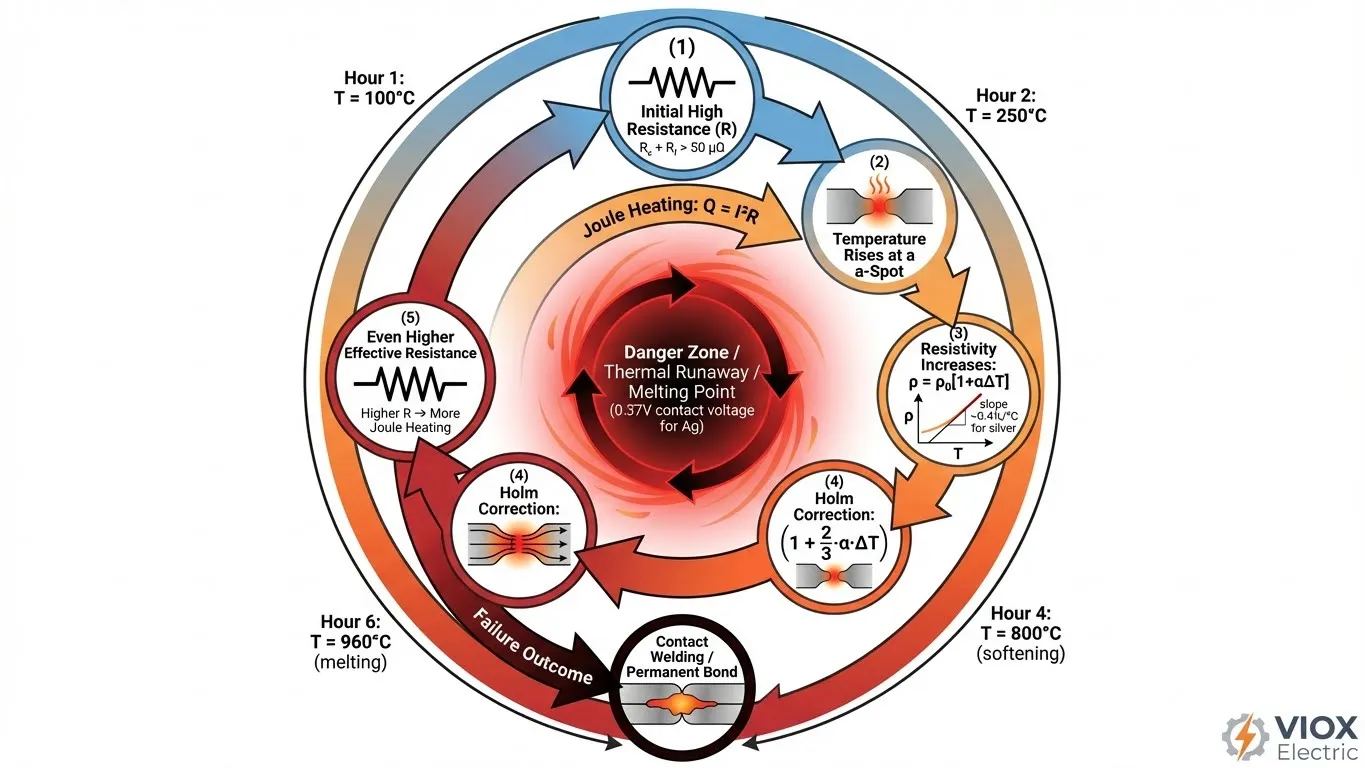
Step 1: Joule Heating
Heat generated = $Q = I^2 \cdot R_k \cdot t$, where $I$ is current (amps), $R_k$ is contact resistance, and $t$ is time. At 200 amps and 50 µΩ resistance, power dissipation is 2 watts per contact pair—concentrated in a tiny volume.
Step 2: Temperature Rise at a-Spot
The a-spot itself heats faster than the bulk conductor because current is confined. Measured contact voltage ($U$) directly correlates to a-spot temperature via the Wiedemann-Franz relation: a contact voltage of 0.1V indicates a-spot temperature ~300°C.
Step 3: Resistance Increases with Temperature
As the a-spot heats, the metal’s resistivity increases ($\rho = \rho_0[1+\alpha\Delta T]$). This raises contact resistance further, generating more heat.
Step 4: Thermal Runaway
If no mechanism limits temperature, the feedback loop accelerates. Resistance climbs, heating accelerates, and the a-spot approaches the material’s softening point.
The Holm Correction Factor
Holm showed that the effective resistance at high temperature increases by a factor of $1 + \frac{2}{3}\alpha(T_{max}-T_0)$, where the 2/3 factor accounts for non-uniform temperature in the constriction zone. This explains why a “hotter” contact develops even higher resistance than simple linear models predict.
Comparison Table: Critical Temperature Thresholds
| Material | Softening Voltage | Softening Temp (°C) | Melting Voltage | Melting Temp (°C) |
|---|---|---|---|---|
| Silver (Ag) | 0.09 V | ~300 | 0.37 V | 960 (material melting point) |
| Copper (Cu) | 0.12 V | ~350 | 0.43 V | 1085 |
| Nickel (Ni) | 0.22 V | ~500 | 0.65 V | 1455 |
| Silver-Cadmium | 0.11 V | ~320 | 0.40 V | Alloy dependent |
Failure Modes: From Hot to Welded
Not all overheating looks the same. Field failures follow distinct patterns:
Mode 1: Thermal Softening
Below melting but above softening voltage, the contact material becomes plastic. The a-spot deforms, increasing contact area, which paradoxically reduces resistance momentarily. But the material weakness persists, and any vibration causes micro-motion and arcing.
Mode 2: Single-Phasing
If only one of three phases degrades (common in asymmetric contamination), its resistance rises while the others remain normal. The single hot phase carries less current (higher resistance = lower current), leaving the load unbalanced. Motor loads can overheat or vibrate under single-phase stress.
Mode 3: Intermittent Contact and Arcing
High resistance causes voltage drop and heat, triggering micro-arcing at the interface. These rapid arc events ionize air, creating conductive plasma, then the contacts cool and resistance climbs again. This cycle generates continuous electromagnetic noise (buzzing) and carbonizes nearby plastic insulation, creating a path to ground or phase-to-phase short.
Mode 4: Contact Welding
The most catastrophic failure. If the a-spot heats above the alloy’s melting point (typically 0.37V contact voltage for silver), the two surfaces fuse together. The ATS becomes mechanically “stuck” in the position where welding occurred, unable to transfer. The equipment is now isolated from both normal and generator power—a complete failure.
Diagnostic Methods: How to Detect Overheating
Early detection saves equipment and facilities. Three methods provide complementary information:
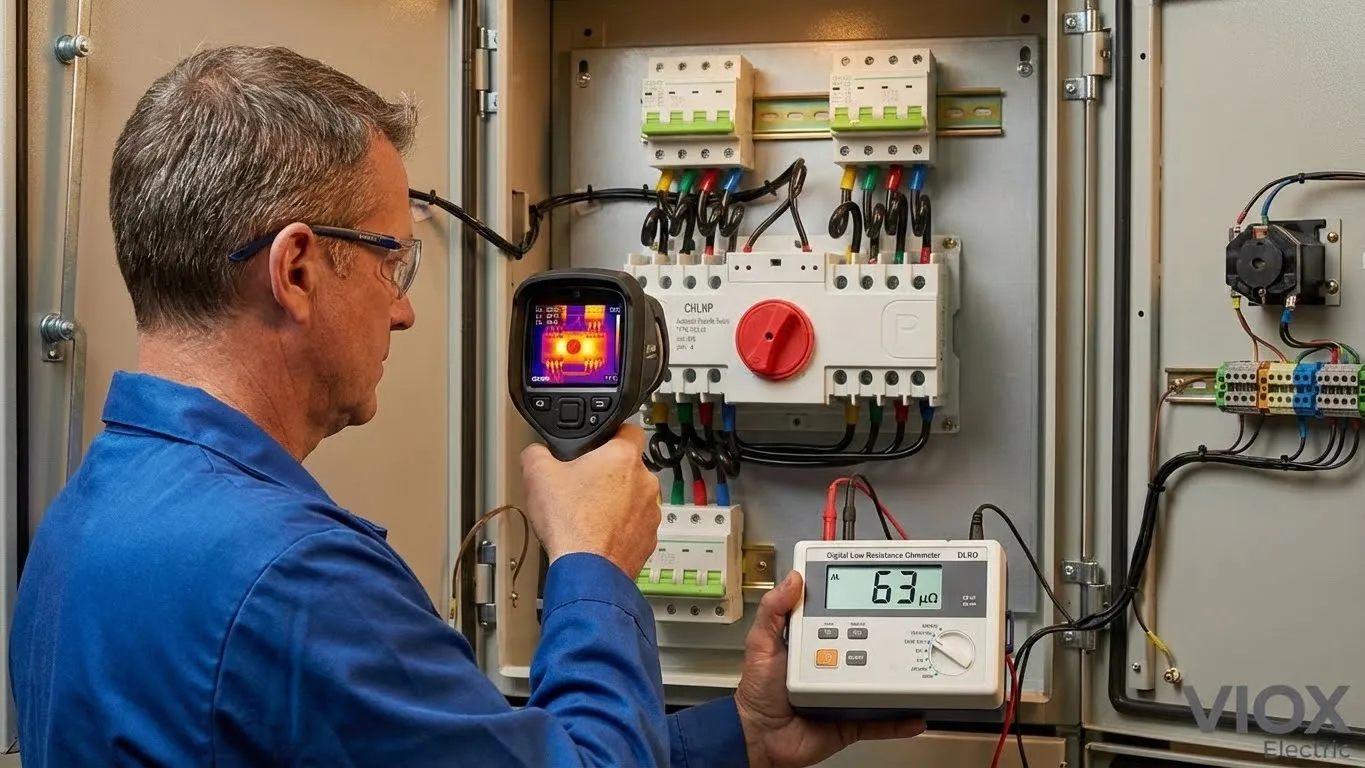
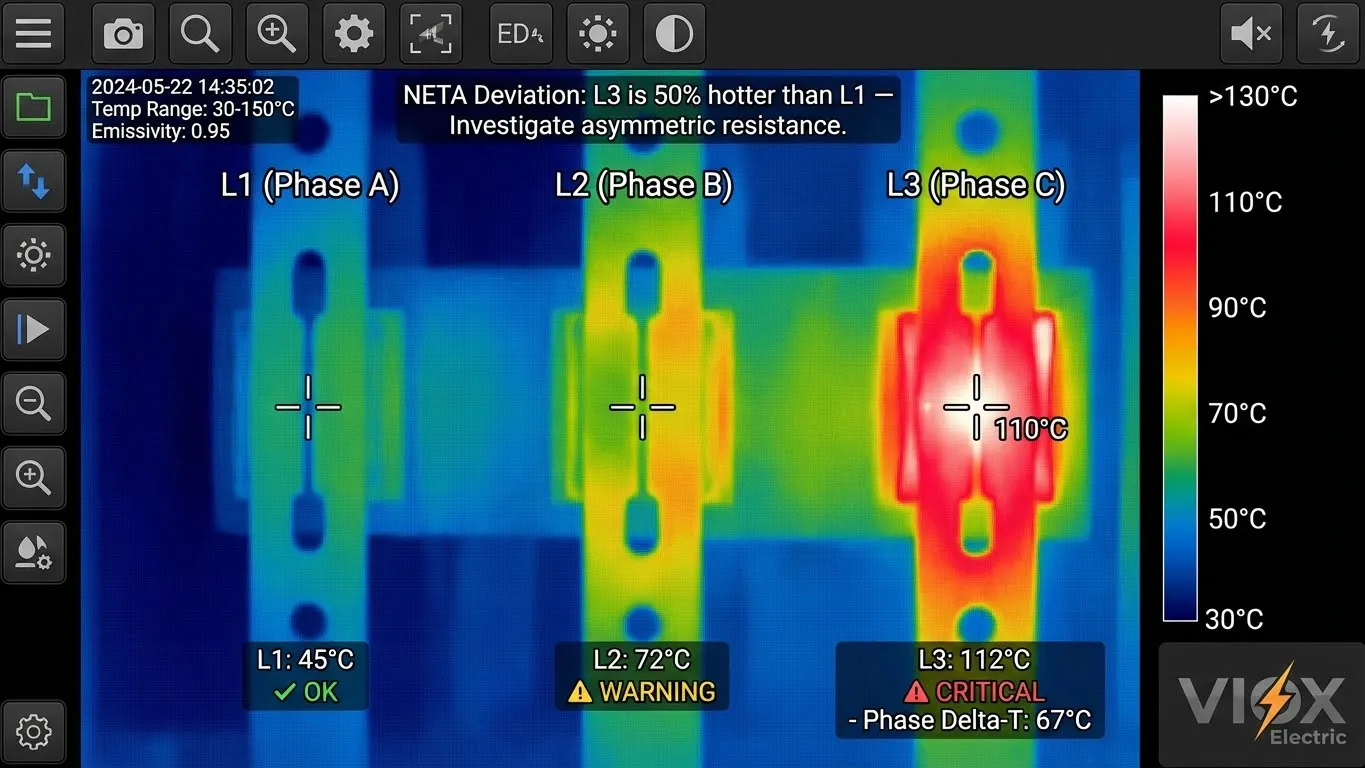
1. Infrared (IR) Thermography
Use a thermal camera while the ATS is under normal building load. Compare the three phases:
- Phase-to-Phase Variation: Healthy contacts show <3°C difference. A difference of >15°C is critical.
- Absolute Temperature: Contacts shouldn’t exceed 50–60°C above ambient in steady state (typical ambient 20°C gives 70–80°C max contact temp). Above 100°C on one phase signals high resistance.
- Timing: Perform thermography monthly on critical backup systems.
2. Digital Low Resistance Ohmmeter (DLRO) Testing
DLRO measures micro-ohms accurately (resolution to 0.1 µΩ). Test each pole independently with at least 10 amps of current:
- Healthy Range: 10–50 µΩ per contact pair (varies by ATS size and contact material)
- Warning Level: 50–100 µΩ (schedule maintenance within 30 days)
- Failure Level: >100 µΩ (replace contacts immediately; do not defer)
- NETA Procedure: Measure all three poles and flag any pole deviating >50% from the lowest reading
3. Visual Inspection & Mechanism Check
- Contact Surface: Discoloration (black tarnish for silver sulfide) indicates film resistance
- Contact Gap: Measure the initial gap when contacts are open; a smaller gap than factory spec suggests erosion or wear
- Closing Force: Manually actuate the mechanism (with power off); it should engage smoothly with audible “click.” Sluggish action suggests worn springs
Diagnostic Decision Table
| Observation | DLRO Reading | IR Delta-T | Action |
|---|---|---|---|
| Discolored contacts + sluggish mechanism | >100 µΩ | >20°C | Replace contacts immediately |
| Slight tarnish, normal mechanism | 50–100 µΩ | 10–15°C | Schedule maintenance in 30 days |
| Clean contacts, smooth mechanism | <50 µΩ | <3°C | Continue normal operation; test again in 6 months |
| One phase noticeably hotter | Varies | >15°C | Investigate asymmetric load; check for loose terminal |
Prevention Strategy: Maintenance Intervals & Benchmarks
Preventing overheating is far cheaper than replacing a failed ATS or dealing with unexpected downtime. A tiered maintenance approach balances cost and reliability:
Monthly (Critical Backup Systems)
- Load-bank test the ATS under 50% rated current while monitoring with IR camera
- Document phase temperatures; flag trends upward >5°C/month
Quarterly
- DLRO test each pole; compare to previous results
- Visual inspection of contact surface and closing mechanism
Annually
- Full-resistance profile at rated current (coordinate with load-bank test)
- Clean contacts with isopropyl alcohol and compressed air (if design permits safe access)
- Verify spring tension per OEM spec; replace springs if deflection is <90% of new
Post-Transfer Inspection (After Any Load Transfer)
- If ATS transferred during a real power outage, DLRO test within 24 hours (contacts may have micro-welded)
- If transfer occurred with transient voltage spikes or arcing sounds, thermal inspect immediately
Benchmark Resistance by ATS Rating
| ATS Rating | Healthy Range | Warning (50% deviation) | Failure |
|---|---|---|---|
| 100 A | 15–40 µΩ | >60 µΩ | >100 µΩ |
| 400 A | 10–30 µΩ | >45 µΩ | >80 µΩ |
| 1200 A | 8–25 µΩ | >35 µΩ | >60 µΩ |
Frequently Asked Questions
Q: How often should I check contact resistance?
A: For facilities with monthly generator exercise tests, check DLRO readings at each test. For standby-only systems (no regular exercise), perform DLRO annually and IR scan every 6 months. After any actual load transfer, test within 24 hours.
Q: Can I clean corroded contacts to restore them?
A: Minor tarnish can be carefully cleaned with isopropyl alcohol and a soft brush, but only if the ATS design allows safe contact access. Deep pitting or erosion requires replacement. Cleaning alone doesn’t restore a-spot geometry lost to arcing.
Q: What’s the difference between “contact resistance” and “contact voltage drop”?
A: Contact voltage drop (measured in volts) = resistance × current. At 200 A through 50 µΩ, the drop is 0.01 V. Measure voltage drop across the contact pair under load, then divide by current to calculate resistance. IR cameras measure the heat consequence of this voltage drop.
Q: Why do some phases heat more than others?
A: Asymmetric contamination, uneven contact force (worn spring on one pole), or loose terminals on one phase. If one phase is consistently 10°C+ hotter, check for an asymmetric load (single large motor) or a loose lug on that phase.
Q: When should contacts be replaced vs. refurbished?
A: Replace if resistance exceeds 100 µΩ, melting voltage is approached (>0.35 V contact drop), or pitting covers >30% of the contact surface. Refurbishment (replating or re-facing) is worthwhile only for contact sets worth >$2,000 and showing <50 µΩ resistance with no pitting.
Conclusion
Contact resistance in ATS equipment isn’t a mystery. It’s physics—predictable and measurable. Armed with an infrared camera and a DLRO meter, any maintenance team can detect degradation months before failure. The physics you’ve learned here translates directly to numbers: benchmark your DLRO readings against the healthy ranges, track trends, and replace contacts when they breach the failure threshold. Your facility’s backup power depends on it.
For more guidance on ATS selection and troubleshooting, refer to our comprehensive ATS Troubleshooting Guide and 3-Step ATS Selection Method. If you’re also investigating general electrical maintenance procedures, our Industrial Contactor Maintenance Checklist covers similar diagnostic principles applicable to other switching equipment.