

이 페이지 정보
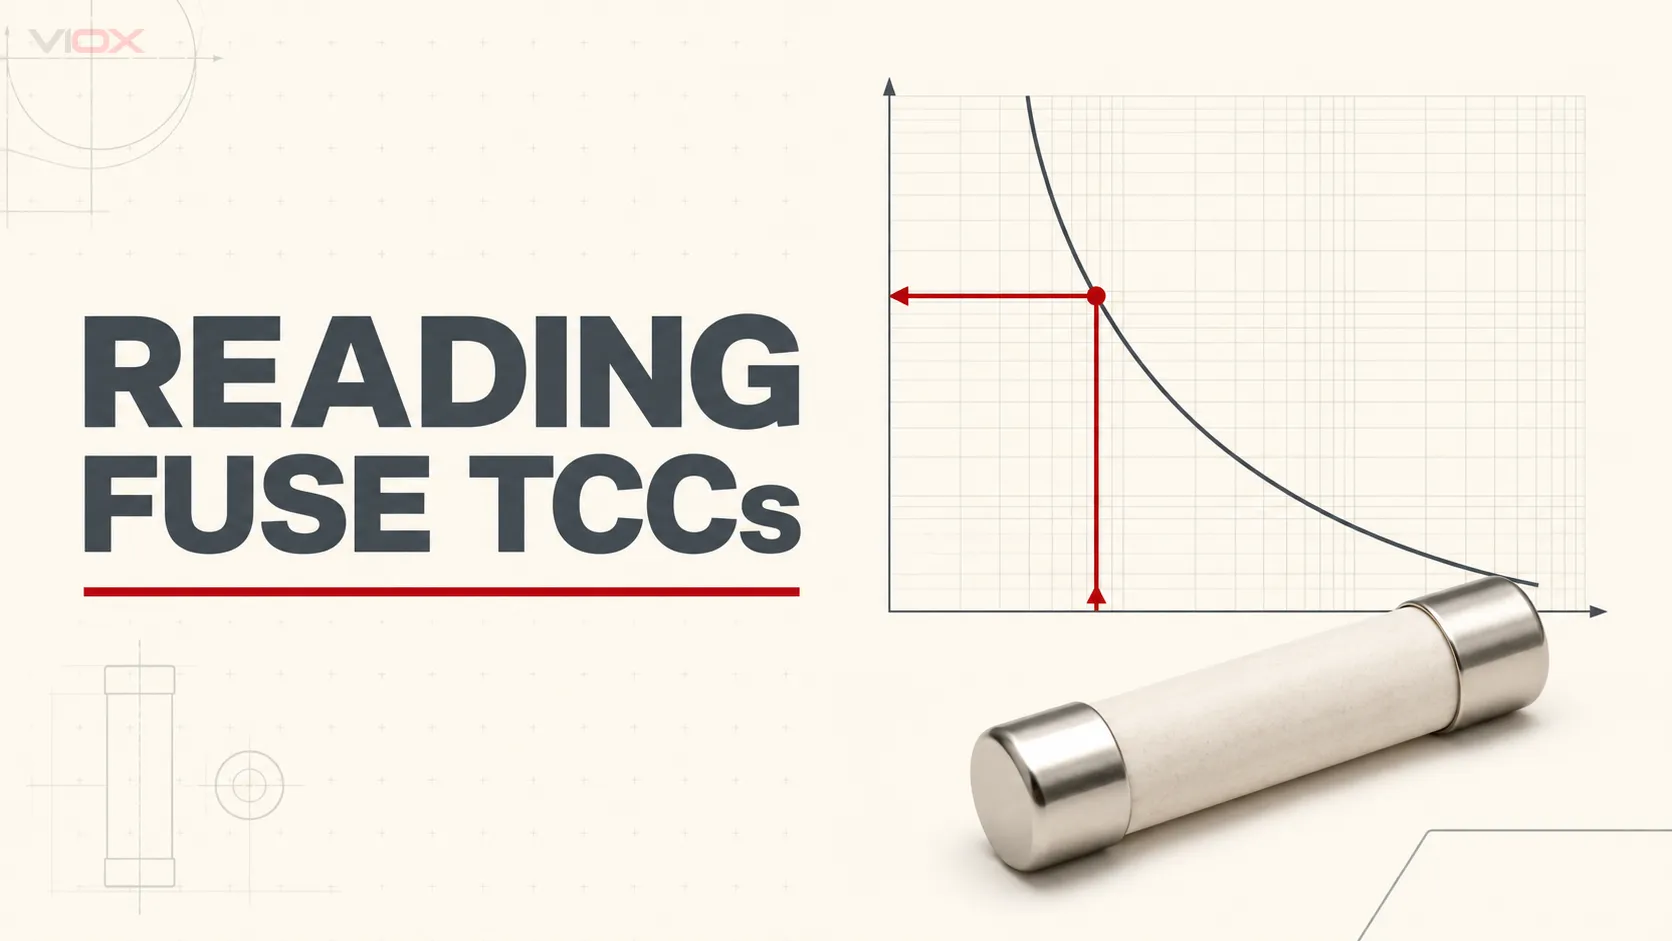
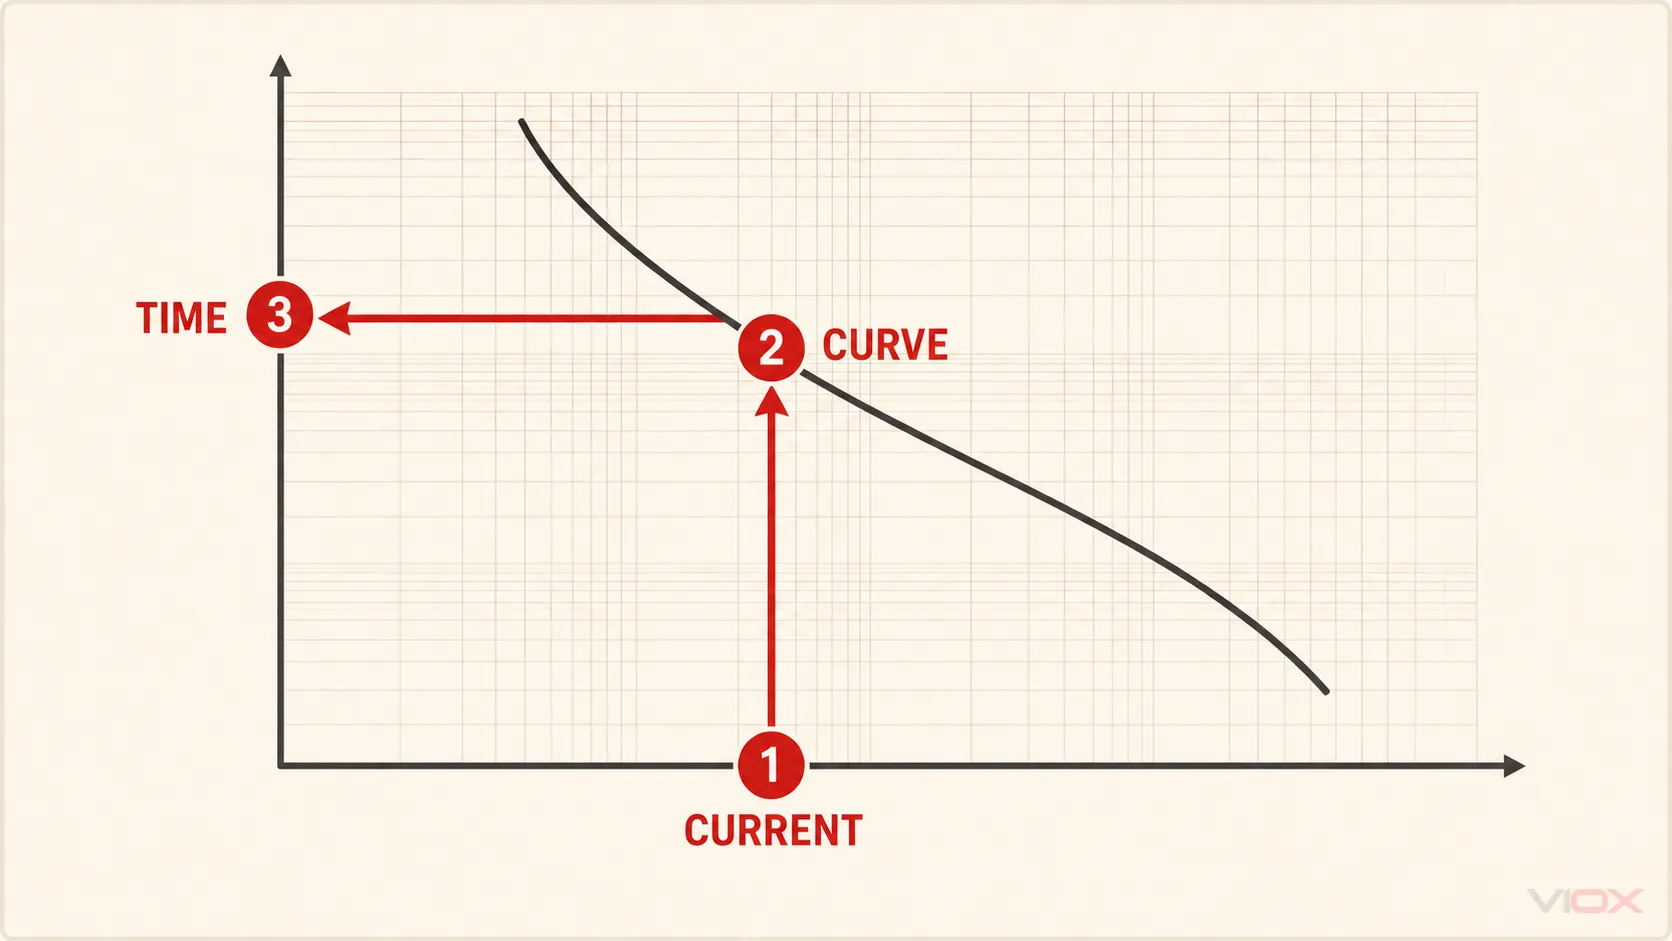
A 퓨즈 시간-전류 곡선(TCC) 과전류가 증가함에 따라 동작 시간이 어떻게 변하는지 보여줍니다. 곡선을 읽으려면 로그 눈금의 가로축에서 필요한 전류를 찾고, 해당 퓨즈 정격 곡선까지 수직으로 이동한 다음, 다시 로그 눈금의 세로축으로 수평 이동하여 시간을 읽으십시오. 필요한 시간을 알고 그에 상응하는 전류를 찾아야 할 때는 이 경로를 반대로 수행하십시오.
이 추적 방법은 작업의 절반에 불과합니다. 결과를 사용하기 전에 해당 시트가 다음 중 무엇을 나타내는지 확인하십시오. 최소 용단(아크 발생 전), 평균 용단 또는 총 차단. 공칭 평균 용단 선은 보장된 차단 한계가 아니며, TCC는 퓨즈의 전압 정격, 차단 용량, I²t, 피크 통과 전류 또는 제조사의 협조 데이터를 대체하지 않습니다.
곡선을 읽기 전에 확인해야 할 6가지 항목
축에서 시작하지 마십시오. 문서 표제란과 범례부터 시작하십시오.
| 확인 | 기록할 사항 | 다음의 경우 중단: |
|---|---|---|
| 퓨즈 제품군 | 제조업체 및 정확한 시리즈 또는 등급 | 곡선이 다른 시리즈에 속함 |
| 퓨즈 정격 | 특정 암페어 곡선 또는 대역 | 필요한 정격이 없고 보간법이 허용되지 않음 |
| 커브 유형 | 최소 용단, 평균 용단 또는 전체 차단 | 곡선 유형이 명시되지 않았거나 확인할 수 없음 |
| 전류 기준 | 암페어, 킬로암페어 또는 정격 전류의 배수 | 축 단위가 불분명함 |
| 시간 기준 | 초, 사이클 또는 기타 명시된 단위 | 프로젝트 요구 사항을 플롯된 단위로 변환할 수 없음 |
| 조건 및 참고 사항 | AC/DC 기준, 시험 전압, 주변 온도 가정, 예비 부하, 허용 오차, 주파수 또는 기타 제조업체 참고 사항 | 의도된 시스템이 게시된 조건 범위를 벗어남 |
시각적으로 유사한 퓨즈에서 가져온 곡선은 대체품이 될 수 없습니다. 동일한 정격 전류를 가진 두 개의 퓨즈 링크라도 사용 범주, 소자 설계, 시간-전류 특성 및 통과 성능이 다를 수 있습니다. VIOX 퓨즈 링크 용어 가이드 는 교체 가능한 퓨즈 링크와 전체 퓨즈 시스템을 별도로 명시해야 하는 이유를 설명합니다.
전류-시간 특성 곡선을 읽는 5단계 방법
설계 질문이 다음과 같을 때 이 순서를 사용하십시오:
지정된 전류에서 이 퓨즈가 용단되거나 차단되는 데 대략 얼마나 걸립니까?
1단계: 정확한 곡선 선택
올바른 퓨즈 제품군 내에서 필요한 암페어 정격으로 표시된 선이나 대역을 찾으십시오. 하나의 시트에 여러 정격이 함께 표시될 수 있습니다. 특히 로그 차트에서는 간격이 좁은 곡선을 혼동하기 쉽습니다.
예상 결과: 문서화된 제조사 부품군 및 암페어 정격과 연결된 하나의 식별된 곡선 또는 대역.
중단 조건: 제조사가 해당 방법을 명시적으로 허용하거나 중간 데이터를 제공하지 않는 한, 인접한 정격 사이의 누락된 곡선을 추정하지 마십시오.
2단계: 가로축에서 전류를 찾으십시오
축 레이블을 주의 깊게 읽으십시오. x축은 다음을 나타낼 수 있습니다:
- 암페어 단위의 실제 전류;
- 킬로암페어 단위의 예상 전류; 또는
- 2 × In 또는 10 × In과 같이 정격 전류의 배수로 표시된 전류.
축이 배수를 사용하는 경우, 차트를 확인하기 전에 배수를 계산하십시오:
전류 배수 = 인가 전류 / 퓨즈 정격 전류100 A를 통전하는 20 A 퓨즈의 경우, 인가 전류는 5 × In입니다. 이 계산은 축상의 한 지점을 식별할 뿐이며, 올바른 곡선 없이는 동작 시간을 예측할 수 없습니다.
예상 결과: 차트와 동일한 단위로 표현된 하나의 전류 값.
중단 조건: 암페어(A)와 In의 배수를 혼용하지 마십시오.
3단계: 곡선 또는 대역까지 수직으로 이동
선택한 전류에서 올바른 퓨즈 곡선과 만날 때까지 수직선을 위로 따라 올라갑니다.
그래프에 단일 평균 용단 곡선이 표시된 경우, 교차점은 공칭 값을 나타냅니다. 대역이나 별도의 최소 용단 및 전체 차단 경계가 표시된 경우, 두 교차점을 모두 기록하십시오.
예상 결과: 공칭 선의 경우 하나의 교차점, 시간 범위의 경우 두 개의 교차점.
중단 조건: 수직선이 여러 퓨즈 정격을 가로지르는 경우, 계속하기 전에 범례를 다시 확인하십시오.
4단계: 시간 축으로 수평 이동하십시오
교차점에서 y축으로 수평선을 따라가십시오. 로그 눈금을 사용하여 시간을 읽으십시오.
1초와 10초 사이의 중간 지점은 5.5초가 아닙니다. 10진 로그 스케일에서 기하학적 중간값은 약 3.16초입니다. 선형적인 시각적 보간법 대신 실제 시트에 제공된 보조 격자 눈금을 사용하십시오.
예상 결과: 공칭 시간 또는 제한된 시간 범위이며, 옆에 곡선 유형이 기재되어 있습니다.
5단계: 결과와 해당 한정자를 기록하십시오
유용한 엔지니어링 참고 사항은 다음과 같습니다:
퓨즈: [제조사, 시리즈, 정격]
인가 전류: [A 또는 In의 배수]
곡선 유형: [최소 용단 / 평균 용단 / 전체 차단]
판독 결과: [시간 또는 범위]
문서: [데이터시트 번호 및 개정판]
조건/제한 사항: [관련 참고 사항]
단순히 “퓨즈가 0.2 s 만에 차단됨”이라고만 기록하지 마십시오. 곡선 유형과 출처가 없으면 다른 독자는 0.2 s가 최소 용단 시간인지, 공칭 용단 시간인지, 아니면 최대 총 차단 시간인지 알 수 없습니다.
시간-전류 특성 곡선 읽는 법
때로는 설계 요구 사항이 반대인 경우도 있습니다:
이 퓨즈가 목표 시간 내에 작동하려면 어떤 전류가 필요한가?
세로축의 요구 시간에서 시작하여 선택한 곡선이나 대역까지 수평으로 이동한 다음, 전류축까지 수직으로 내려갑니다.
이 방향은 다음을 확인할 때 유용합니다:
- 알려진 단락 전류가 요구되는 작동 시간 영역에 도달하는지 여부;
- 짧은 돌입 전류 펄스가 퓨즈의 용단 영역으로 진입하는지 여부;
- 동일한 퓨즈 제품군 내에서 정의된 시간-전류 요구 사항에 가장 가까운 게시된 정격은 무엇인가.
그 답은 게시된 곡선 유형과 관련이 있습니다. 평균 용단 곡선에서 읽은 전류가 해당 시간 내에 최대 차단을 보장하지는 않습니다.
작업 예시: 게시된 Mersen AJT30 곡선 읽기
Mersen의 한 페이지짜리 시간-전류 곡선을 읽는 방법 는 AJT 시간 지연 Class J 제품군을 사용합니다. 해당 시트에는 용단 시간-전류 데이터, 라고 표시되어 있으며, Mersen은 자사의 연속 곡선을 공칭 평균 용단 시간으로 설명합니다.
게시된 AJT30 곡선:
- x축의 다음 지점에서 시작하십시오: 160 A.
- 수직으로 이동하여 30 A 곡선에 도달하십시오.
- 수평으로 이동하여 시간 축에 도달하십시오.
- 게시된 판독값은 다음과 같습니다 10초.
반대 방향으로 읽기:
- y축의 다음 지점에서 시작: 0.1 초.
- 수평으로 이동하여 다음 지점으로: 30 A 곡선에 도달하십시오.
- 전류 축으로 아래로 이동합니다.
- 게시된 판독값은 다음과 같습니다 320 A.
| Question | 게시된 곡선 경로 | Mersen 예시의 결과 |
|---|---|---|
| 160 A에서 얼마나 걸립니까? | 160 A → AJT30 곡선 → 시간 축 | 10 s |
| 0.1 s에 해당하는 전류는 얼마입니까? | 0.1 s → AJT30 곡선 → 전류 축 | 320 A |
이 값들은 해당 제조사 곡선을 읽는 방법을 보여줍니다. 이 값들은 모든 30 A 퓨즈에 적용되는 보편적인 값이 아니며, 제조사에서 발표한 평균 용단 특성을 나타낼 뿐, 모든 AJT30이 정확히 그 시간에 회로를 완전히 차단한다는 포괄적인 보증은 아닙니다. 전압 정격, 차단 정격, 적용 분야 및 기타 제조사 데이터가 최종 선택을 결정합니다.
최소 용단, 평균 용단 및 총 차단 시간은 서로 다릅니다
곡선 주변의 라벨이 해당 수치의 의미를 결정합니다.
| 곡선 또는 용어 | 무엇을 나타내는가 | 적절한 사용 | 증명하지 못하는 것 |
|---|---|---|---|
| 최소 용단 / 최소 아크 전 단계 | 지정된 전류에서 퓨즈 소자가 용단될 수 있는 가장 빠른 시간 | 라이드스루(ride-through) 및 협조 경계 확인 | 최종 차단 시간 |
| 평균 용단 | 공칭 또는 일반적인 소자 용단 특성 | 일반적인 비교 및 근사 특성 | 보장된 최소 또는 최대값 |
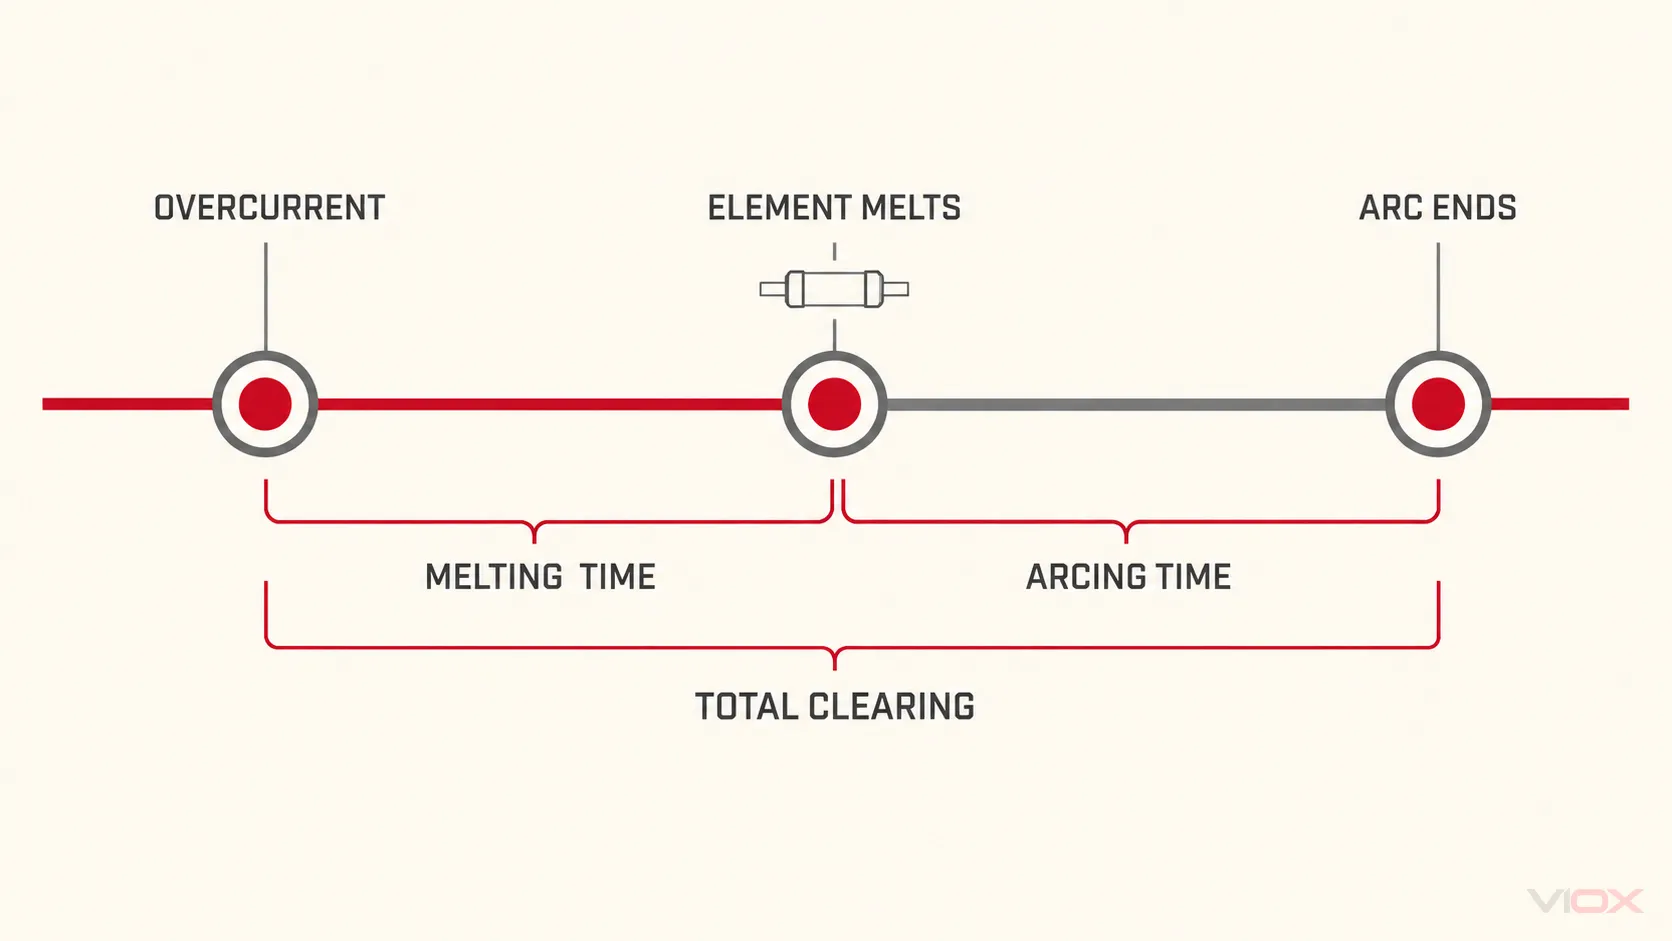
| 아크 시간 | 소자 용단부터 전류가 차단될 때까지의 시간 | 용단과 차단 사이의 간격 이해 | 고장 발생 시점부터의 전체 응답 |
| 전체 차단 | 용단 시간과 아크 시간의 합 | 공표된 최대 차단 경계 | 통과 및 내성 데이터를 확인하지 않는 장비 보호 |
| 허용 오차 범위 | 관련 최소 및 최대 곡선으로 제한된 범위 | 보수적인 시간 범위 해석 | 단일 정확한 동작 시간 |
Eaton은 차단 시간을 과전류 시작부터 최종 회로 차단까지의 총 간격으로 정의하며, 이는 용단 시간과 아크 시간을 합한 것입니다. Mersen의 선택적 조정 지침 또한 최소 용단 곡선과 총 차단 곡선을 구분하며, 평균선이 아닌 해당 경계를 사용하여 장치 간의 분리 성능을 평가합니다.
용어는 지역 및 제조업체에 따라 다를 수 있습니다. “Pre-arcing(아크 전)”은 요소가 녹기 전의 기간을 나타내는 데 일반적으로 사용되며, 일부 문헌에서는 “용단 시간(melting time)”을 사용합니다. 모든 카탈로그가 동일한 라벨을 사용한다고 가정하지 말고 정확한 데이터 소스에 인쇄된 정의를 읽으십시오.
두 축이 모두 로그 눈금인 이유
퓨즈의 동작은 광범위한 전류와 시간에 걸쳐 나타납니다. 하나의 차트에서 장시간 과부하 동작과 반주기 고전류 동작을 모두 표시해야 할 수 있습니다. 로그 축은 이러한 수십 배의 범위를 읽기 쉬운 그래프로 압축합니다.
10진법 축에서:
| 주 간격 | 일반적인 보조 값 |
|---|---|
| 1에서 10 | 2, 3, 4, 5, 6, 7, 8, 9 |
| 10에서 100 | 20, 30, 40, 50, 60, 70, 80, 90 |
| 0.01에서 0.1 | 0.02, 0.03, 0.04, 0.05 등 |
10과 20 사이의 시각적 간격은 20과 30 사이의 간격과 동일하지 않습니다. 차트 해상도가 결정을 내리기에 불충분한 경우, 작은 이미지에서 추측하지 말고 제조업체의 디지털 데이터, 조정 소프트웨어 또는 더 명확한 곡선을 확보하십시오.
곡선 판독을 엔지니어링 검토로 전환하기
시간-전류 판독값은 회로 요구 사항과 비교될 때만 유용합니다. 일반적으로 세 가지 프로필이 중요합니다.
1. 정상 부하 및 돌입 전류 프로필
예상되는 기동, 자화, 충전 또는 기타 과도 전류의 크기와 지속 시간을 도표로 그리거나 설명하십시오. 해당 프로필이 필요한 설계 여유 및 작동 조건 하에서 제조업체의 용단 경계 밖에 있는지 확인하십시오.
단순히 암페어 정격을 높여 오동작 문제를 해결하지 마십시오. 그러한 변경은 도체 또는 장비 보호 기능을 약화시킬 수 있습니다. 퓨즈 제품군, 시간 지연 동작, 주변 조건, 홀더 열 제한 및 실제 돌입 전류 파형을 확인하십시오.
2. 보호 도체 또는 장비 제한
퓨즈의 차단 경계와 해당 도체 또는 장비의 내량 정보를 비교하십시오. 퓨즈는 보호 대상의 허용 열적 한계 또는 손상 한계를 초과하기 전에 유해한 과전류를 차단해야 합니다.
일반적인 TCC만으로는 이를 확립할 수 없습니다. 필요한 한계값은 해당 설계 방식, 장비 데이터 또는 대상 시장의 관할 당국으로부터 얻어야 합니다.
3. 상류 및 하류 보호
직렬로 연결된 두 퓨즈의 경우, 일반적인 곡선 확인은 다음을 사용합니다. 하류 장치의 전체 차단 경계 그리고 상류 장치의 최소 용단 경계. 평가된 범위 내에서 하류 장치의 전체 차단 곡선이 상류 장치의 최소 용단 곡선과 분리되어 유지되는 경우, 하류 퓨즈가 해당 도표 범위 내에서 먼저 동작할 것으로 예상됩니다.
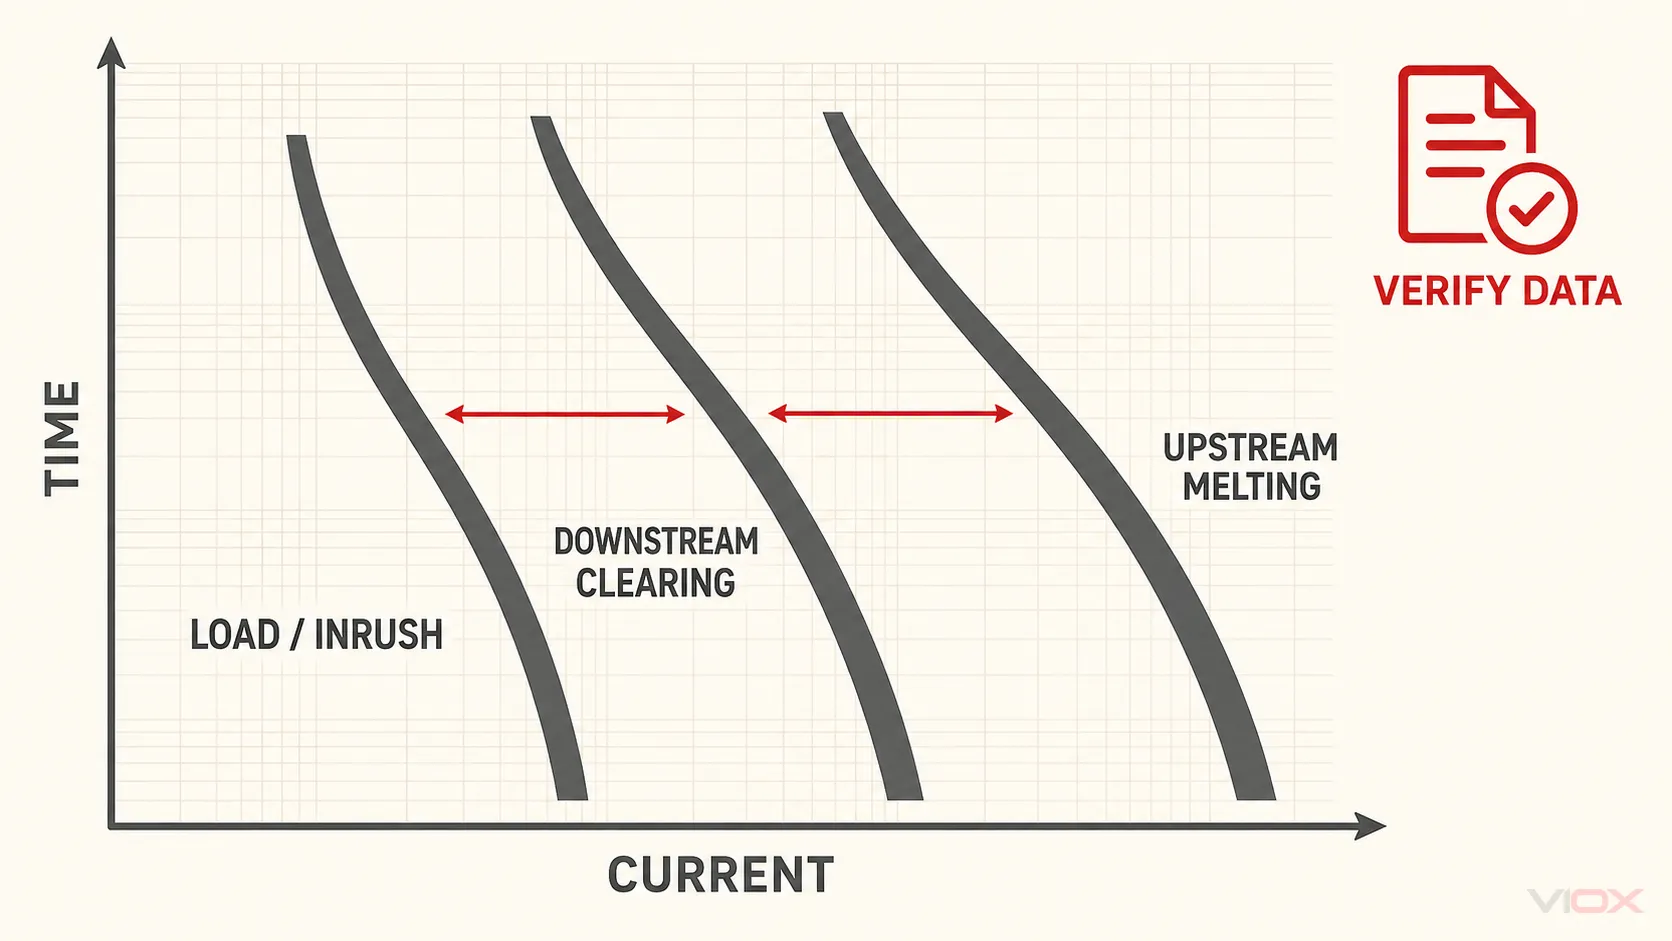
이는 선별 규칙이며 보편적인 협조 인증은 아닙니다. Mersen은 전류 제한 장치 및 회로 차단기의 순시 동작이 포함된 경우 일반적인 TCC 분석이 선택성을 정확하게 나타내지 못할 수 있다고 언급합니다. 제조업체의 선택성 표, 테스트된 조합, 피크 전류 데이터, I²t 데이터 또는 공식적인 보호 연구가 필요할 수 있습니다.
별도의 기술 비교를 위해서는 VIOX의 퓨즈 대 MCB 응답 시간 가이드를 참조하십시오. 차단기 B/C/D 및 전자식 트립 곡선에 대해서는 다음을 사용하십시오 회로 차단기 트립 곡선 가이드.
I²t가 적용되는 범위와 TCC가 종료되는 지점
TCC는 전류 크기와 시간을 연관시킵니다. I²t 시간에 따른 전류 제곱의 적분을 설명합니다:
I²t = ∫ i²(t) dt고장 전류는 차단 중에 변화하므로, 하나의 가정된 정전류에 하나의 시간 값을 곱하는 것보다 적분값이 더 정확합니다.
퓨즈 데이터는 다음을 구분할 수 있습니다:
- 용융 또는 아크 전 I²t: 소자 용융까지의 에너지 적분;
- 아크 I²t: 아크 발생 중의 에너지 적분;
- 총 차단 I²t: 최종 차단까지의 결합 적분.
정확한 제조사 정의 및 테스트 조건을 사용하십시오. Eaton의 퓨즈 기술 지침은 펄스 I²t와 퓨즈 용단 I²t 비교 시 적용 파형 및 제품 지침을 고려해야 함을 강조합니다. Littelfuse 또한 시간-전류 곡선과 피크 통과 전류 곡선을 구분하는데, 후자는 전류 제한 차단 중에 실제로 통과하는 피크 전류를 다룹니다.
다음과 같은 경우 TCC만으로는 충분하지 않습니다:
- 반도체 또는 전력 전자 기기의 내량;
- 전류 제한 영역에서의 높은 예상 단락 전류;
- 피크 전기 기계적 응력;
- 캐스케이딩, 백업 보호 또는 테스트된 선택적 조합;
- 회로 차단기의 순시 영역으로 진입하는 혼합 퓨즈 및 차단기 시스템;
- 프로젝트별 선택성 요구 사항 준수.
그러한 경우에는 제조업체의 I²t 표, 피크 통과 전류 차트, 선택성 표, 정확한 장치 곡선 및 필요한 모든 연구 데이터를 확보하십시오.
일반적인 판독 오류 및 시정 조치
| 오류 | 실패 원인 | 올바른 조치 |
|---|---|---|
| 정확한 정격 대신 가장 가까운 퓨즈 정격을 판독함 | 인접한 정격은 곡선이 크게 다를 수 있음 | 정확한 정격 곡선을 확보할 것 |
| 평균선을 보장된 한계치로 취급함 | 평균 용단 시간은 허용 오차를 제외하며 아크 시간을 포함하지 않을 수 있음 | 최소 용단 및 전체 차단 경계 사용 |
| 로그 축을 선형으로 읽기 | 추정 지점은 게시된 값과 크게 다를 수 있음 | 표시된 로그 세분화 단위를 따를 것 |
| 암페어와 In의 배수를 혼동함 | 곡선을 읽기 전에 x축 지점이 잘못됨 | 단위를 명시적으로 변환 |
| “차단(opens)”이 항상 전체 차단을 의미한다고 가정함 | 제조업체 용어 및 곡선 라벨은 서로 다릅니다 | 문서의 정확한 용어를 기록하십시오 |
| 관련 없는 시험 기준의 곡선 비교 | 겉보기상의 분리가 동일한 조건을 나타내지 않을 수 있습니다 | 호환 가능한 제조업체/프로젝트 데이터를 사용하십시오 |
| 전류 제한 영역에서 TCC만 사용하는 경우 | 피크 전류 및 에너지가 결과에 영향을 미칠 수 있습니다 | I²t, 피크 통과 전류 및 선택성 데이터를 확인하십시오 |
| 암페어 정격만으로 선택 | 전압, 차단 용량, 등급, 홀더 및 적용 분야가 미해결 상태로 남음 | 전체 퓨즈 사양을 완료하십시오 |
퓨즈 TCC 판독 워크시트
이 표를 설계 기록 또는 조달 검토 문서에 복사하십시오.
| 분야 | 프로젝트 항목 |
|---|---|
| 제조업체 | |
| 퓨즈 제품군 / 시리즈 | |
| 카탈로그 번호 | |
| 정격 전류 | |
| 정격 전압 및 AC/DC 기준 | |
| 차단 정격 | |
| 곡선 문서 및 개정 | |
| 커브 유형 | |
| 가로축 단위 | |
| 세로축 단위 | |
| 인가 전류 또는 요구 시간 | |
| 용단 시간 값 또는 범위 판독 | |
| 총 차단 시간 값 또는 범위 판독 | |
| 부하/돌입 전류 프로파일 확인됨 | 예 / 아니요 |
| 보호 대상 장비 또는 도체 제한 확인됨 | 예 / 아니요 |
| 상류/하류 협조 확인됨 | 예 / 아니요 |
| I²t 데이터 필요 및 확인됨 | 예 / 아니요 / 해당 없음 |
| 피크 통과 전류 데이터 필요 및 확인됨 | 예 / 아니요 / 해당 없음 |
| 제조업체 선택성 표 또는 연구 필요 | 예 / 아니요 / 해당 없음 |
| 가정 사항 및 미해결 항목 |
완전한 퓨즈 사양을 위해서는 올바른 사용 범주 또는 퓨즈 등급, 물리적 형태, 홀더 호환성 및 적용 조건이 필요합니다. 다음으로 시작하십시오. VIOX 전기 퓨즈 가이드 더 넓은 장치 및 선택 맥락을 위해; 다음을 사용하십시오. IEC 60269 퓨즈 선택 가이드 IEC 등급 및 시스템 경계를 위해; 그런 다음 다음을 사용하십시오. VIOX 퓨즈 제품 페이지 제품군 평가를 위한 상업적 경로로 활용하십시오.
퓨즈 승인 전 최종 검증
타당한 TCC 결과는 다음 다섯 가지 질문에 모두 답할 수 있어야 합니다:
- 이것이 정확한 제조사 제품군 및 암페어 정격입니까?
- 결과값이 최소 용단, 평균 용단, 또는 전체 차단 중 무엇을 나타냅니까?
- 로그 눈금을 올바른 단위로 읽었습니까?
- 퓨즈가 의도된 부하 프로파일을 견디고 적용 가능한 손상 경계 이전에 차단합니까?
- TCC만으로는 불충분한 경우 I²t, 피크 통과 전류, 선택성 표 및 기타 정격들을 확인했습니까?
답변이 불확실한 경우, 해당 선택을 잠정적인 것으로 유지하십시오. 확인 가능한 제품 문의를 위해서는 시스템 전압, AC/DC 듀티, 정상 전류, 돌입 전류 프로파일, 예상 고장 전류, 퓨즈 등급, 요구 동작 시간, 홀더 형식 및 협조 요구 사항을 다음으로 보내주십시오. [email protected].